 Global| Oct 22 2012
State Unemployment Rates Are Improved But Vary Greatly
by:Tom Moeller
|in:Economy in Brief
Summary
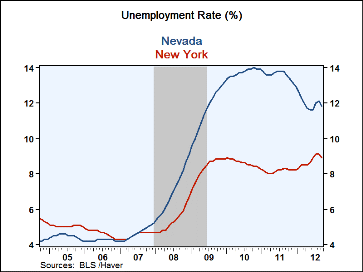
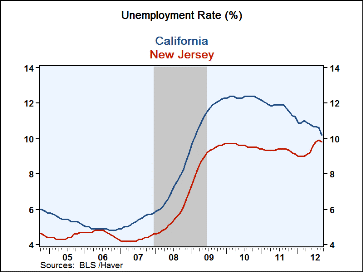
Throughout the United States, the unemployment rate has fallen to some degree from its recession high. However, there are notable exceptions. In New Jersey and New York, for example, unemployment rates recently reached new highs. In [...]
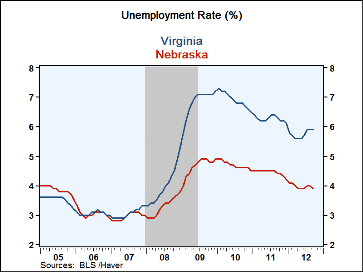
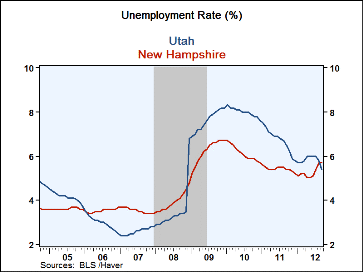
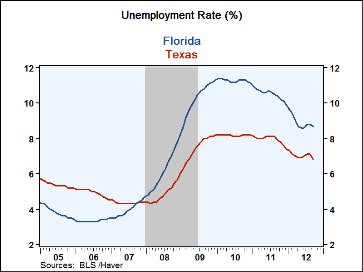
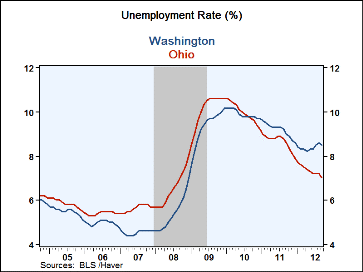
Throughout the United States, the unemployment rate has fallen to some degree from its recession high. However, there are notable exceptions. In New Jersey and New York, for example, unemployment rates recently reached new highs. In Connecticut, the September rate of 8.9% was just slightly below its peak. The accompanying tables indicate the unemployment rates in large and small states.
In the two largest states, California and Texas, unemployment rates have declined by one-to-two percentage points from their peaks. However, the unemployment rate in California remains one of the highest in the country and more than three percentage points higher than in Texas. The unemployment rates in the least populated states, including the Dakotas, Nebraska and Iowa, remain low. State unemployment figures are available in Haver's EMPLR database.
This economic recovery has been a mild one throughout the country. Moreover, it's not been broad-based amongst economic sectors. The result has been great variation in states' unemployment rate performance. Currently, U.S. GDP growth is expected by NABE to average just 2.2% next year. While that's a slight pickup from this year, it's not expected to materially reduce the overall unemployment rate. Without any strong momentum in the total, the pattern of little improved and divergent unemployment rates amongst states likely will continue.
| State Unemployment Rate | September | August | 2011 | 2010 | 2009 | Labor Force |
|---|---|---|---|---|---|---|
| Total U.S. | 7.8% | 8.1% | 9.0% | 9.6% | 9.3% | 155.1 mil. |
| Ten States With Highest Jobless Rate | ||||||
| Nevada | 11.8 | 12.1 | 13.6 | 13.7 | 11.6 | 1.4 |
| Rhode Island | 10.5 | 10.7 | 11.3 | 11.7 | 10.9 | 0.6 |
| California | 10.2 | 10.6 | 11.8 | 12.3 | 11.3 | 18.5 |
| New Jersey | 9.8 | 9.9 | 9.3 | 9.6 | 9.0 | 4.6 |
| North Carolina | 9.6 | 9.7 | 10.5 | 10.9 | 10.5 | 4.7 |
| Mississippi | 9.2 | 9.1 | 10.7 | 10.5 | 9.4 | 2.3 |
| South Carolina | 9.1 | 9.6 | 10.3 | 11.2 | 11.5 | 2.1 |
| Georgia | 9.0 | 9.2 | 9.8 | 10.2 | 9.8 | 4.8 |
| New York | 8.9 | 9.1 | 8.2 | 8.6 | 8.3 | 9.5 |
| Connecticut | 8.9 | 9.0 | 8.8 | 9.3 | 8.2 | 1.9 |
| States With Lowest Jobless Rate | September | August | 2011 | 2010 | 2009 | Labor Force |
|---|---|---|---|---|---|---|
| Virginia | 5.9% | 5.9% | 6.3% | 6.9% | 6.9% | 4.3 mil. |
| Minnesota | 5.8 | 5.9 | 6.4 | 7.3 | 8.0 | 3.0 |
| New Hampshire | 5.7 | 5.7 | 5.4 | 6.1 | 6.2 | 0.7 |
| Utah | 5.4 | 5.8 | 6.7 | 8.0 | 7.6 | 1.3 |
| Wyoming | 5.4 | 5.7 | 6.0 | 7.0 | 6.3 | 0.3 |
| Vermont | 5.4 | 5.3 | 5.6 | 6.4 | 6.9 | 0.4 |
| Iowa | 5.2 | 5.5 | 5.9 | 6.3 | 6.2 | 1.7 |
| South Dakota | 4.4 | 4.5 | 4.7 | 5.0 | 5.1 | 0.4 |
| Nebraska | 3.9 | 4.0 | 4.4 | 4.7 | 4.7 | 1.0 |
| North Dakota | 3.0 | 3.0 | 3.5 | 3.8 | 4.1 | 0.4 |
| Jobless Rate In Other Selected Large States | September | August | 2011 | 2010 | 2009 | Labor Force |
|---|---|---|---|---|---|---|
| Florida | 8.7% | 8.8% | 10.5% | 11.3% | 10.4% | 9.3 mil. |
| Washington | 8.5 | 8.6 | 9.2 | 9.9 | 9.4 | 3.5 |
| Tennessee | 8.3 | 8.5 | 9.2 | 9.8 | 10.5 | 3.1 |
| Indiana | 8.2 | 8.3 | 9.0 | 10.1 | 10.4 | 3.1 |
| Arizona | 8.2 | 8.3 | 9.5 | 10.5 | 9.9 | 3.0 |
| Colorado | 8.0 | 8.2 | 8.3 | 8.9 | 8.1 | 2.7 |
| Wisconsin | 7.3 | 7.5 | 7.5 | 8.4 | 8.8 | 3.1 |
| Ohio | 7.0 | 7.2 | 8.6 | 10.0 | 10.1 | 5.8 |
| Louisiana | 7.0 | 7.4 | 7.3 | 7.5 | 6.7 | 2.1 |
| Maryland | 6.9 | 7.1 | 7.1 | 7.8 | 7.4 | 3.1 |
| Texas | 6.8 | 7.1 | 7.9 | 8.2 | 7.5 | 12.6 |
Tom Moeller
AuthorMore in Author Profile »Prior to joining Haver Analytics in 2000, Mr. Moeller worked as the Economist at Chancellor Capital Management from 1985 to 1999. There, he developed comprehensive economic forecasts and interpreted economic data for equity and fixed income portfolio managers. Also at Chancellor, Mr. Moeller worked as an equity analyst and was responsible for researching and rating companies in the economically sensitive automobile and housing industries for investment in Chancellor’s equity portfolio. Prior to joining Chancellor, Mr. Moeller was an Economist at Citibank from 1979 to 1984. He also analyzed pricing behavior in the metals industry for the Council on Wage and Price Stability in Washington, D.C. In 1999, Mr. Moeller received the award for most accurate forecast from the Forecasters' Club of New York. From 1990 to 1992 he was President of the New York Association for Business Economists. Mr. Moeller earned an M.B.A. in Finance from Fordham University, where he graduated in 1987. He holds a Bachelor of Arts in Economics from George Washington University.


