 Global| May 25 2005
Spanish GDP Growth Maintains Firm Pace; Chain-Linking Introduced
Summary
GDP in Spain grew 0.9% in Q1, the same as in Q4, according to the quarterly data released this morning by the National Statistics Institute. Boosts to the quarter's performance came from government consumption, up 2.6%, and a drop in [...]

GDP in Spain grew 0.9% in Q1, the same as in Q4, according to the quarterly data released this morning by the National Statistics Institute. Boosts to the quarter's performance came from government consumption, up 2.6%, and a drop in imports of 1.6%. Household consumption grew 0.6%, slower than in Q4, and capital formation also expanded more slowly. Exports decreased 1.7%, their second successive decline, pulling them down 2.5% compared to a year ago. However, an accompanying decrease in imports stabilized the real net export balance with the Q4 amount.
In today's report, Spain has switched to chain-linking for calculating quarterly real growth and inflation; the reference year for these calculations is 2000. The data previously used fixed 1995 weights. [Some annual data on the new basis were reported last week.] As seen in the graph and in the table below, growth is consistently higher in the new figures. In 2002 and 2003 this resulted from stronger gains in fixed investment, but through the last year or so, household consumption has been much more vigorous than under the former calculation scheme.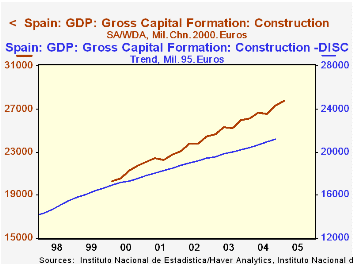
In the US experience, chain-weighting has a different impact: it tends to reduce total growth and, in particular, that of investment expenditures. It dilutes the effect of heavier buying of equipment, for which prices are falling. But in Spain, the reported volume of investment spending has been raised, perhaps because of the sizable role of construction in the Spanish economy. Construction is a considerably larger share of nominal GDP, 16.7% in Q1, than in the US, 10.2%. Construction prices have increased relative to total GDP, so that item has generally benefited from the chain-weighting process. Its greater weight in turn gives more lift to the total chain-weighted GDP result.
| Q1 2005 | Q4 2004 | Q3 2004 | Year/ Year | 2004 | 2003 | 2002 | |
|---|---|---|---|---|---|---|---|
| GDP - 2000 Prices | 0.9 | 0.9 | 0.7 | 3.1 | 3.1 | 2.9 | 2.7 |
| Memo: GDP - 1995 Prices | -- | 0.8 | 0.6 | 2.7 | 2.5 | 2.2 | |
| Household Consumption | 0.6 | 1.7 | 1.4 | 4.6 | 4.4 | 2.5 | 2.8 |
| Gross Fixed Capital Formation | 0.9 | 3.4 | 2.2 | 6.5 | 4.4 | 5.3 | 3.3 |
| Exports | -1.7 | -0.8 | 1.4 | -2.5 | 2.8 | 3.6 | 1.8 |
| Imports | -1.6 | 1.6 | 3.5 | 5.5 | 8.1 | 6.3 | 3.8 |
Carol Stone, CBE
AuthorMore in Author Profile »Carol Stone, CBE came to Haver Analytics in 2003 following more than 35 years as a financial market economist at major Wall Street financial institutions, most especially Merrill Lynch and Nomura Securities. She had broad experience in analysis and forecasting of flow-of-funds accounts, the federal budget and Federal Reserve operations. At Nomura Securities, among other duties, she developed various indicator forecasting tools and edited a daily global publication produced in London and New York for readers in Tokyo. At Haver Analytics, Carol was a member of the Research Department, aiding database managers with research and documentation efforts, as well as posting commentary on select economic reports. In addition, she conducted Ways-of-the-World, a blog on economic issues for an Episcopal-Church-affiliated website, The Geranium Farm. During her career, Carol served as an officer of the Money Marketeers and the Downtown Economists Club. She had a PhD from NYU's Stern School of Business. She lived in Brooklyn, New York, and had a weekend home on Long Island.
More Economy in Brief


