 Global| Jan 09 2007
Small Business Optimism Fell Again
by:Tom Moeller
|in:Economy in Brief
Summary
Small business optimism fell for the second consecutive month in December. The 3.2% decline followed a 1.0% November slip and left optimism 10.4% below its peak in late 2004, according to the National Federation of Independent [...]
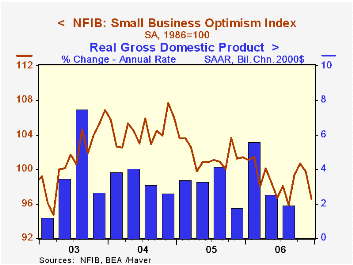
Small business optimism fell for the second consecutive month in December. The 3.2% decline followed a 1.0% November slip and left optimism 10.4% below its peak in late 2004, according to the National Federation of Independent Business (NFIB).
During the last ten years there has been a 70% correlation between the level of the NFIB index and the two quarter change in real GDP.
Respondents expecting the economy to improve dropped sharply while the percentage of firms with job openings and those expecting higher real sales in six months fell moderately.
During the last ten years there has been a 72% correlation between the NFIB percentage and the y/y change in nonfarm payrolls.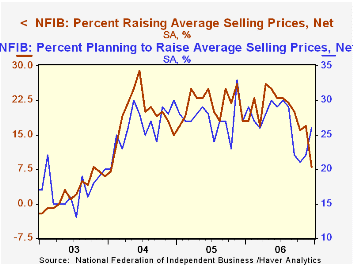
The percent planning to raise capital expenditures also dropped sharply to a three year low.
The percentage of firms planning to raise average selling prices rose moderately but the percentage of firms actually raising prices fell to the lowest level since early 2004. During the last ten years there has been a 60% correlation between the change in the producer price index and the level of the NFIB price index.
About 24 million businesses exist in the United States. Small business creates 80% of all new jobs in America.
The Economic Outlook, yesterday's speech by Federal Reserve Board Vice Chairman Donald L. Kohn, can be found here.
| Nat'l Federation of Independent Business | December | November | Y/Y | 2006 | 2005 | 2004 |
|---|---|---|---|---|---|---|
| Small Business Optimism Index (1986=100) | 96.5 | 99.7 | -4.9% | 98.9 | 101.6 | 104.6 |
by Tom Moeller January 9, 2007
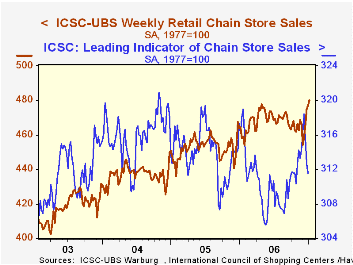
The ICSC-UBS retail chain-store sales index is constructed using the same-store sales (stores open for one year) reported by 78 stores of seven retailers: Dayton Hudson, Federated, Kmart, May, J.C. Penney, Sears and Wal-Mart.
Going the other way, the leading indicator of chain store sales from ICSC-UBS fell for the third straight week and posted a 0.4% decline.Mortgage Innovation and Consumer Choice from the Federal Reserve Bank of San Francisco is available here.
| ICSC-UBS (SA, 1977=100) | 1/06/07 | 12/30/06 | Y/Y | 2006 | 2005 | 2004 |
|---|---|---|---|---|---|---|
| Total Weekly Chain Store Sales | 480.3 | 476.8 | 3.4% | 3.3% | 3.6% | 4.7% |
by Tom Moeller January 9, 2007
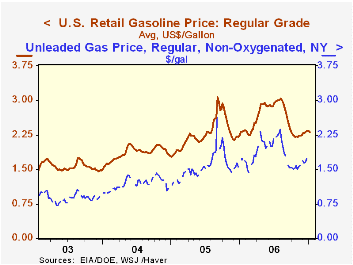
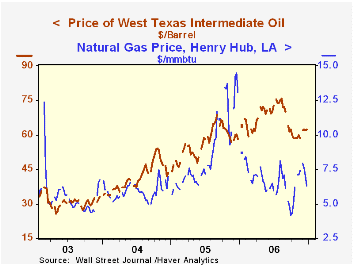 Warmer weather also has helped crude oil prices lower. Yesterday, the spot price for WTI crude settled at $57.83 (-8.9% y/y), down four dollars from the December average of $61.94.
Warm temperatures also have pushed natural gas prices lower to $5.53 per mmbtu but a recent forecast of colder temps raised futures to $8.57
The latest Short-Term Energy Outlook from the U.S. Energy Information Administration is available here.
Warmer weather also has helped crude oil prices lower. Yesterday, the spot price for WTI crude settled at $57.83 (-8.9% y/y), down four dollars from the December average of $61.94.
Warm temperatures also have pushed natural gas prices lower to $5.53 per mmbtu but a recent forecast of colder temps raised futures to $8.57
The latest Short-Term Energy Outlook from the U.S. Energy Information Administration is available here.
Recycling Petrodollars from the Federal Reserve Bank of New York Can be found here.
| Weekly Energy Prices | 01/08/07 | 01/01/07 | Y/Y | 2006 | 2005 | 2004 |
|---|---|---|---|---|---|---|
| US Retail Gasoline Price, Regular | $2.31 | $2.33 | -0.9% | $2.57 | $2.27 | $1.85 |
by Louise Curley January 9, 2007
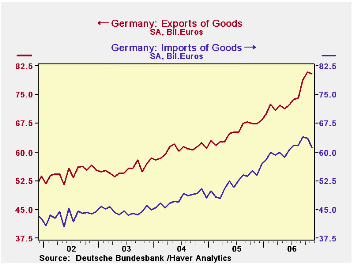
Recent data from Germany are generally positive. Exports, while still strong, declined slightly in November from 80.9 billion euros in October to 80.5 billion euros--the result perhaps of the strong euro. However, imports declined by an even greater amount from 63.6 billion euros in October to 61.2 billion euros in November with the result that the trade balance increased to !9.3 billion euros from 17.3 billion euros in October. The first chart shows German exports and imports of goods.
Industrial production in November increased 1.8% from October and was 6.1% above November, 2005. Construction, which, earlier this year, appeared to have bottomed out, was particularly strong--up 6.2% in November and 13.4% above November, 2005--due in part to the unseasonally warm weather. Production in manufacturing, however, also increased 1.5% from October and 6.2$ from November, 2005. The second chart shows German industrial production in construction and manufacturing.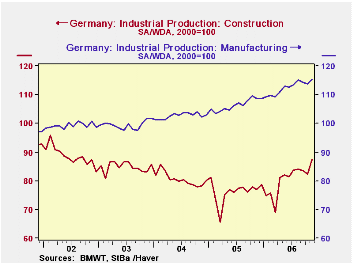
In spite of the deceleration in exports in November, the value of foreign manufacturing new orders increased 2.1% in November and were 6.4% above November, 2005. Domestic new orders increased only 0.6% in November from October, but were 9.9% above November, 2005. In the third chart, showing domestic and foreign new manufacturing orders, it can be seen that domestic new orders began to strengthen back in mid 2005 and to accelerate in the second quarter of 2006.
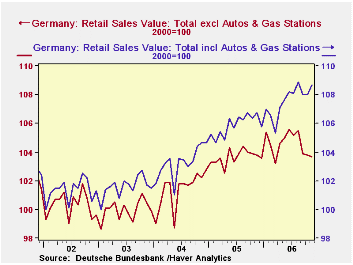
Retail sales have been the soft spot in the German economy. In view of the increased employment, noted earlier by Carol Stone, and the increase in the Value Added Tax on January 1, 2007, expectations had been for strong retail sales in the final months of 2006. Retail sales excluding autos and related stores, however, declined 1.5% in September, 0.1% in October and 0.1% again in November. Sales including autos and related stores did not fare much better. They were, respectively, -0.8%, 0.0% and 0.7%. The fourth chart shows retail sales excluding and including autos and related stores. The widening gap between the two series in recent months suggests that the impending increase in the VAT may have had at least stimulated purchases of autos.(We have rebased the retail sales from 2003=100 to 2000=100 to facilitate comparisons with the Industrial Production and New Orders data.)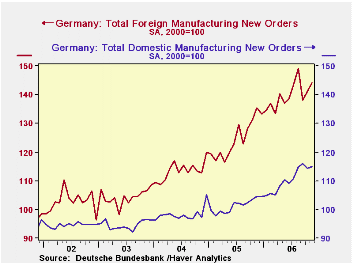
| GERMANY | Nov 06 | Oct 06 | Nov 05 | M/M % | Y/Y % | 2005 | 2004 | 2003 |
|---|---|---|---|---|---|---|---|---|
| Exports (Bil Euro) | 80.46 | 80.87 | 67.33 | -0.51 | 19.50 | 783.62 | 727.41 | 666.78 |
| Imports (Bil Euro) | 61.17 | 63.58 | 52.82 | -3.79 | 13.66 | 625.87 | 572.60 | 535.83 |
| Balance on Goods (Bil Euro) | 19.29 | 17.29 | 13.51 | 2.00* | 5.78* | 157.75 | 154.81 | 130.95 |
| Industrial Production (2000=100) | 112.0 | 110.0 | 105.6 | 1.82 | 6.06 | 103.7 | 100.8 | 98.4 |
| Manufacturing | 115.4 | 113.7 | 108.7 | 1.50 | 6.16 | 106.4 | 102.7 | 99.5 |
| Construction | 87.9 | 82.3 | 72.1 | 6.20 | 13.36 | 76.7 | 80.6 | 84.9 |
| Mfg New Orders Value (2000=100) | 128.0 | 126.3 | 118.3 | 1.35 | 8.20 | 111.7 | 105.0 | 99.0 |
| Domestic | 115.0 | 114.3 | 104.6 | 0.61 | 9.94 | 101.4 | 98.3 | 94.6 |
| Foreign | 144.2 | 141.3 | 135.5 | 2.05 | 6.42 | 124.6 | 113.5 | 104.4 |
| Retail Sales excl autos, etc (2000=100) | 103.7 | 103.8 | 103.8 | -0.10 | -0.10 | 103.7 | 101.4 | 100.0 |
| Retail Sales incl autos, etc (2000=100) | 107.2 | 106.5 | 105.3 | 0.66 | 1.80 | 104.4 | 101.9 | 100.2 |

Tom Moeller
AuthorMore in Author Profile »Prior to joining Haver Analytics in 2000, Mr. Moeller worked as the Economist at Chancellor Capital Management from 1985 to 1999. There, he developed comprehensive economic forecasts and interpreted economic data for equity and fixed income portfolio managers. Also at Chancellor, Mr. Moeller worked as an equity analyst and was responsible for researching and rating companies in the economically sensitive automobile and housing industries for investment in Chancellor’s equity portfolio. Prior to joining Chancellor, Mr. Moeller was an Economist at Citibank from 1979 to 1984. He also analyzed pricing behavior in the metals industry for the Council on Wage and Price Stability in Washington, D.C. In 1999, Mr. Moeller received the award for most accurate forecast from the Forecasters' Club of New York. From 1990 to 1992 he was President of the New York Association for Business Economists. Mr. Moeller earned an M.B.A. in Finance from Fordham University, where he graduated in 1987. He holds a Bachelor of Arts in Economics from George Washington University.
More Economy in Brief


