 Global| Oct 11 2005
Small Business Optimism Again Slipped Moderately
by:Tom Moeller
|in:Economy in Brief
Summary
The index of small business optimism from the National Federation of Independent Business (NFIB) fell another 0.9% in September following a 0.2% decline the month earlier. Hurricanes Katrina and Rita drastically cut expectations for [...]
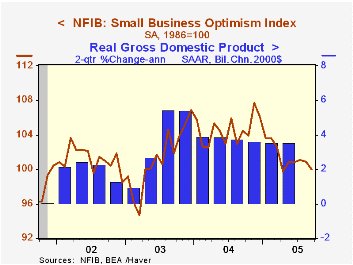
The index of small business optimism from the National Federation of Independent Business (NFIB) fell another 0.9% in September following a 0.2% decline the month earlier.
Hurricanes Katrina and Rita drastically cut expectations for sales and for the economy, however, plans for adding to employment and capital expenditures held steady.
During the last ten years there has been a 70% correlation between the level of the NFIB index and the two quarter change in real GDP.
The percentage of firms with one or more job openings slipped slightly to 23%. During the last ten years there has been a 67% correlation between hiring plans and the three month growth in nonfarm payrolls.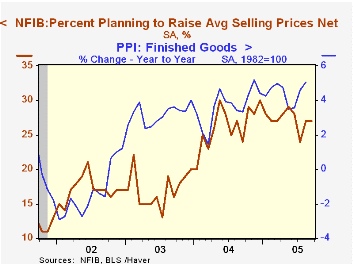
The percentage of firms planning to raise average selling prices held steady m/m at 27% up from 26% during all of last year. During the last ten years there has been a 60% correlation between the change in the producer price index and the level of the NFIB price index.
About 24 million businesses exist in the United States. Small business creates 80% of all new jobs in America.
The latest press release from the NFIB is available here.
| Nat'l Federation of Independent Business | Sept | Aug | Y/Y | 2004 | 2003 | 2002 |
|---|---|---|---|---|---|---|
| Small Business Optimism Index (1986=100) | 100.0 | 100.9 | -4.3% | 104.6 | 101.3 | 101.2 |
by Tom Moeller October 11, 2005
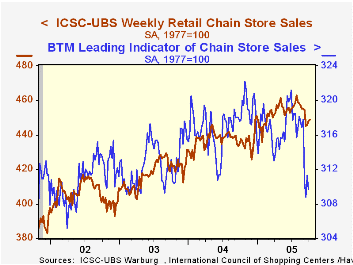
Chain store sales added 0.2% last week to the prior week's 0.6% jump, according to the International Council of Shopping Centers (ICSC)-UBS survey. Though sales have risen during the past three successive weeks, the level in early October was 0.2% below the September average which fell 1.7% from the August average, .
During the last ten years there has been a 56% correlation between the y/y change in chain store sales and the change in non-auto retail sales less gasoline, as published by the US Census Department. Chain store sales correspond directly with roughly 14% of non-auto retail sales less gasoline. The leading indicator of chain store sales from ICSC dropped 0.5% (-2.5% y/y) for the second time in three weeks and the decline was the fifth since the middle of August. The ICSC-UBS retail chain-store sales index is constructed using the same-store sales (stores open for one year) reported by 78 stores of seven retailers: Dayton Hudson, Federated, Kmart, May, J.C. Penney, Sears and Wal-Mart.The Economics of Giving from the Federal Reserve Bank of St. Louis is available here.
| ICSC-UBS (SA, 1977=100) | 10/08/05 | 10/01/05 | Y/Y | 2004 | 2003 |
|---|---|---|---|---|---|
| Total Weekly Chain Store Sales | 448.9 | 448.0 | 2.7% | 4.6% | 2.9% |
by Louise Curley October 11, 2005
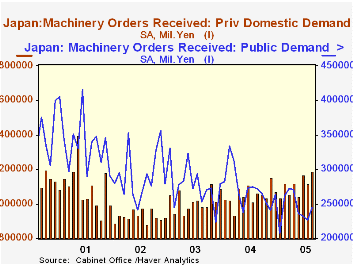
Japanese data on machinery orders were released today by the Economic and Social Research Institute of the Cabinet Office of the Government of Japan. Although total machinery orders declined by 8.8% in August from July, there were several encouraging trends among the details of the data. Some of the good news is obscured by the extreme volatility of even the seasonally adjusted series. The decline was largely the result of a 28% decline in foreign orders, which tend to vary substantially from month to month. Although volatile, the trend of foreign orders has been positive since early 2002. Both public and private orders rose, 8.1% and 6.0% respectively. Even though the monthly rise in public orders at 8% was greater than that of private orders at 6%, it is clear from the first chart that shows the value of private and public orders that public orders have been on a declining trend and private orders on a rising one since 2001.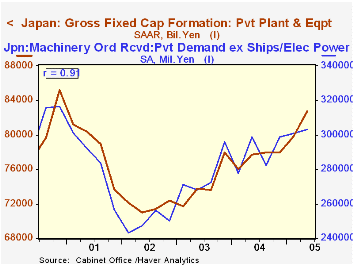
One of the most closely watched series is "Private orders excluding ships and electric power," which tends to be a good indicator of future capital spending. The second chart compares these orders aggregated on a quarterly basis with private expenditures on plant and equipment from the national accounts. As can be seen there is a close relationship with a correlation of .91. These orders rose 8.2% in August and reached the highest level since October, 2000.
Japan's Nikkei 225 Stock Price Average has been rising strongly since earlier this year and reached 13,556.71 (5/16/49=100) today the highest value since May, 2001. While "Private orders excluding ships and electric power" are not the sole factor responsible for the rise, the series it is representative of the generally improving news on the Japanese economy which may be a prime factor in the advance of stock prices. In the final chart we show the Nikkei, aggregated on a monthly basis and the monthly series, "Private orders excluding ships and electric power".
| Japan: Orders (Billion Yen) |
Aug 05 | Jul 05 | Aug 04 | M/M % | Y/Y % | 2004 Mo Avg | 2003 Mo Avg | 2002 Mo Avg |
|---|---|---|---|---|---|---|---|---|
| Total | 2245.6 | 2465.0 | 2290.3 | -8.78 | -1.82 | 2216.0 | 2110.9 | 1832.3 |
| Foreign | 709.8 | 978.8 | 845.1 | -27.98 | -16.01 | 777.5 | 709.4 | 517.6 |
| Public | 244.5 | 226.3 | 271.6 | 8.04 | -9.98 | 272.6 | 276.7 | 291.3 |
| Private | 1186.8 | 1114.4 | 1062.6 | 6.50 | 11.69 | 1050.8 | 1016.7 | 928.7 |
| Private excl ships and electric power | 1095.9 | 1013.3 | 963.5 | 8.15 | 13.74 | 964.5 | 922.9 | 830.7 |

Tom Moeller
AuthorMore in Author Profile »Prior to joining Haver Analytics in 2000, Mr. Moeller worked as the Economist at Chancellor Capital Management from 1985 to 1999. There, he developed comprehensive economic forecasts and interpreted economic data for equity and fixed income portfolio managers. Also at Chancellor, Mr. Moeller worked as an equity analyst and was responsible for researching and rating companies in the economically sensitive automobile and housing industries for investment in Chancellor’s equity portfolio. Prior to joining Chancellor, Mr. Moeller was an Economist at Citibank from 1979 to 1984. He also analyzed pricing behavior in the metals industry for the Council on Wage and Price Stability in Washington, D.C. In 1999, Mr. Moeller received the award for most accurate forecast from the Forecasters' Club of New York. From 1990 to 1992 he was President of the New York Association for Business Economists. Mr. Moeller earned an M.B.A. in Finance from Fordham University, where he graduated in 1987. He holds a Bachelor of Arts in Economics from George Washington University.
More Economy in Brief


