 Global| Mar 25 2005
Sluggish Exports, Surging Imports Produce Big Trade Deficit in India
Summary
Some months ago, we wrote here expressing surprise that India sustains a deficit in merchandise trade. Media coverage might give the impression that it, like China, runs a substantial surplus. But this is not the case, and in fact, [...]

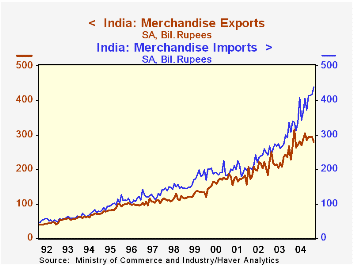
Some months ago, we wrote here expressing surprise that India sustains a deficit in merchandise trade. Media coverage might give the impression that it, like China, runs a substantial surplus. But this is not the case, and in fact, the trade deficit is gapping wider persistently. It averaged 83 billion rupees a month in 2004, with the first three quarters of the year equal to 3.2% of GDP. In February, it was a record 161 billion rupees.
As seen in the graph, developments in both exports and imports have contributed to the widening of the trade deficit. Exports have flattened. Strange as that may seem, they have hovered near 280 billion rupees monthly since last June. Among the most important products, cotton yarn and clothing shipments have steadied or even drifted lower. Jewelry and gems are very erratic, but a moving average gives some suggestion of plateauing or edging down a bit. By contrast, machinery sales have remained firm.
Imports have risen sharply. As noted in the table below, they were up more than 31% in 2004, although the most recent, February figure is "just" 5.7% above a year earlier. Petroleum is an obvious culprit, up 35.5% in 2004 and a whopping 80.0% in February from February 2004. But other items show strength as well: gold and steel in particular each rose roundly 60% in 2004 as a whole.
We argued before that a good portion of Indian imports are probably used to produce items for export or as investment in expanding production facilities; this enumeration of individual import items would seem to corroborate those comments. Thus, one seems to hear little about a burgeoning Indian trade gap. Further, until the middle of last year, the widely publicized work in the services industries along with surpluses in invisibles and income accounts were more than enough to cover the trade shortfall, so the current account held a surplus. However, in Q3 last year, reductions in those positive component balances joined the wider trade deficit to produce a deficit in the overall current account as well. With the subsequently larger trade gaps, it will likely be difficult for those services and income inflows to regenerate a surplus in the current account.
| India: Trade | Feb 2005* | Jan 2005* | Year Ago | 2004 | 2003 | 2002 |
|---|---|---|---|---|---|---|
| Exports % Change | -4.7 | -0.6 | 4.2 | 23.0 | 13.6 | 16.5 |
| Imports % Change | 5.7 | 0.1 | 29.0 | 31.6 | 20.6 | 15.1 |
| Balance (Billion Rupees) | -160.90 | -18.49 | -60.16 | -82.96** | -48.19** | -28.33** |
Carol Stone, CBE
AuthorMore in Author Profile »Carol Stone, CBE came to Haver Analytics in 2003 following more than 35 years as a financial market economist at major Wall Street financial institutions, most especially Merrill Lynch and Nomura Securities. She had broad experience in analysis and forecasting of flow-of-funds accounts, the federal budget and Federal Reserve operations. At Nomura Securities, among other duties, she developed various indicator forecasting tools and edited a daily global publication produced in London and New York for readers in Tokyo. At Haver Analytics, Carol was a member of the Research Department, aiding database managers with research and documentation efforts, as well as posting commentary on select economic reports. In addition, she conducted Ways-of-the-World, a blog on economic issues for an Episcopal-Church-affiliated website, The Geranium Farm. During her career, Carol served as an officer of the Money Marketeers and the Downtown Economists Club. She had a PhD from NYU's Stern School of Business. She lived in Brooklyn, New York, and had a weekend home on Long Island.
More Economy in Brief
 Global| Feb 05 2026
Charts of the Week: Balanced Policy, Resilient Data and AI Narratives
by:Andrew Cates


