 Global| Nov 19 2003
Single Family Housing Starts Set Record
by:Tom Moeller
|in:Economy in Brief
Summary
Housing starts surged unexpectedly in October, rising 2.9% m/m to the highest level since January 1986. Consensus forecasts had been for a moderate decline versus September, which was revised up. Single family starts rose 5.7% m/m to [...]

Housing starts surged unexpectedly in October, rising 2.9% m/m to the highest level since January 1986. Consensus forecasts had been for a moderate decline versus September, which was revised up.
Single family starts rose 5.7% m/m to a record high 1.617M. Year-to-date, single family starts are up 7.3% versus all of last year.
Multi-family starts slipped 8.5% m/m and year-to-date are down 2.6% versus last year.
Huge declines in total housing starts in the Northeast and in the Midwest were offset last month by strength elsewhere. The 18.0% decline in starts in the Northeast mostly reflected lower multi-family starts. The same was true for the 8.0% decline in starts in the Midwest. Starts rose in other regions of the country, but the 18.6% m/m gain in single family starts in the West (16.8% y/y) was notable.
Building permits rose 5.2% m/m reflecting a 3.2% increase in single family permits and an 18.7% rise in permits for 5 or more unit structures.
| Housing Starts (000s, AR) | Oct | Sept | Y/Y | 2002 | 2001 | 2000 |
|---|---|---|---|---|---|---|
| Total | 1,960 | 1,905 | 18.6% | 1,711 | 1,601 | 1,573 |
| Single-family | 1,617 | 1,530 | 18.4% | 1,364 | 1,272 | 1,232 |
| Multi-family | 343 | 375 | 19.5% | 347 | 330 | 341 |
| Building Permits | 1,973 | 1,875 | 8.8% | 1,750 | 1,637 | 1,598 |
by Tom Moeller November 19, 2003

The National Association of Home Builders (NAHB) reported that their Composite Housing Market Index fell in November to 69 (+7.8% y/y). Though the index has been volatile in recent months, it remained near four-year highs.
During the last fifteen years there has been a 79% correlation between the y/y change in the NAHB index and the change in single family housing starts.
The index of current market conditions for home sales fell a slight 1.3% m/m to 77 (8.5% y/y).
The index which measures expected home sales in six months fell 3.7% m/m to 79 (12.9% y/y).
Traffic of prospective buyers slacked off to the lowest level since May.
The NAHB index is a diffusion index based on a survey of builders. Readings above 50 signal that more builders view conditions as good than poor.
Visit the National Association of Home Builders using this link.
| Nat'l Association of Home Builders | Nov | Oct | Y/Y | 2002 | 2001 | 2000 |
|---|---|---|---|---|---|---|
| Composite Housing Market Index | 69 | 72 | 64 | 61 | 56 | 62 |
by Tom Moeller November 19, 2003
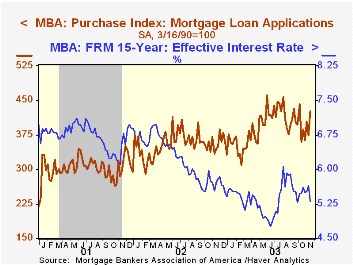
The index of mortgage applications compiled by the Mortgage Bankers Association jumped 5.9% last week (-44.7% y/y) and recouped most of the prior week's decline. Nevertheless, applications remained near the three month low.
Purchase applications jumped 13.5% (+23.4% y/y) to the highest level since early September. Applications to refinance fell another 1.9% (-66.9% y/y).
During the last ten years there has been a 54% correlation between the y/y change in purchase applications and the change in new plus existing home sales.
The effective interest rate on a conventional 30-Year mortgage fell sharply w/w to 5.95%, the lowest level since late September. The effective rate on a 15-year mortgage also fell w/w to 5.30%.
The Mortgage Bankers Association surveys between 20 to 35 of the top lenders in the U.S. housing industry to derive its refinance, purchase and market indexes. The weekly survey accounts for more than 40% of all applications processed each week by mortgage lenders. Visit the Mortgage Bankers Association site here.
| MBA Mortgage Applications (3/16/90=100) | 11/14 | 11/07 | 2002 | 2001 | 2000 |
|---|---|---|---|---|---|
| Total Market Index | 663.2 | 626.0 | 799.7 | 625.6 | 322.7 |
| Purchase | 425.9 | 375.5 | 354.7 | 304.9 | 302.7 |
| Refinancing | 2,043.9 | 2,084.2 | 3,388.0 | 2,491.0 | 438.8 |
by Tom Moeller November 19, 2003
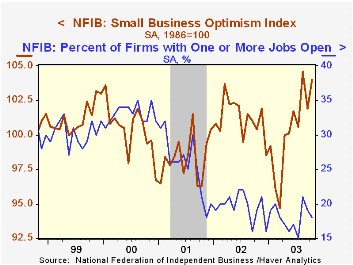
The Small Business Optimism Index for October published by the National Federation of Independent Business recouped virtually all of the prior month's decline. The index rose 2.1% m/m to a near-record reading of 104.0
The increase reflected a rise to 13% in the percent of small business owners planning to increase employment. Nevertheless, The percentage of firms with one or more jobs open fell to 18%. That is near the middle of the range in place since early last year.
The percent of owners planning to raise capital expenditures in the next 3-6 months recovered some of the September decline and rose to 28%.
About 24 million businesses exist in the United States. Small business creates 80% of all new jobs in America.
| Nat'l Federation of Independent Business | Oct | Sept | Y/Y | 2002 | 2001 |
|---|---|---|---|---|---|
| Small Business Optimism Index (1986=100) | 104.0 | 101.9 | 3.6% | 101.2 | 98.4 |

Tom Moeller
AuthorMore in Author Profile »Prior to joining Haver Analytics in 2000, Mr. Moeller worked as the Economist at Chancellor Capital Management from 1985 to 1999. There, he developed comprehensive economic forecasts and interpreted economic data for equity and fixed income portfolio managers. Also at Chancellor, Mr. Moeller worked as an equity analyst and was responsible for researching and rating companies in the economically sensitive automobile and housing industries for investment in Chancellor’s equity portfolio. Prior to joining Chancellor, Mr. Moeller was an Economist at Citibank from 1979 to 1984. He also analyzed pricing behavior in the metals industry for the Council on Wage and Price Stability in Washington, D.C. In 1999, Mr. Moeller received the award for most accurate forecast from the Forecasters' Club of New York. From 1990 to 1992 he was President of the New York Association for Business Economists. Mr. Moeller earned an M.B.A. in Finance from Fordham University, where he graduated in 1987. He holds a Bachelor of Arts in Economics from George Washington University.
More Economy in Brief


