 Global| Oct 07 2009
Several Indicators Signal U.S. Inflationary Upturn
by:Tom Moeller
|in:Economy in Brief
Summary
Liquidity has long been viewed as having the potential for fueling inflationary problems for an economy. Before that problem actually emerges, several "market-based" indicators help provide a market view of the pricing outlook. While [...]
Liquidity has long been viewed as having the potential for fueling inflationary problems for an economy. Before that problem actually emerges, several "market-based" indicators help provide a market view of the pricing outlook. While hardly precise, the figures do give a measure of risk. Some view that risk as an outgrowth of how much liquidity there is in the economy, and by all measures, inflationary pressures are set to rise.
 So far, the inflationary environment has been tame. Through
August, lower oil prices dropped the y/y change in the CPI to -1.4%
although recent gains in prices have raised the three-month rate to
4.9%. During that period "core" prices power fell to 1.5% on both a
twelve and three-month basis, down from a high of 2.9% during the
summer of 2006.
So far, the inflationary environment has been tame. Through
August, lower oil prices dropped the y/y change in the CPI to -1.4%
although recent gains in prices have raised the three-month rate to
4.9%. During that period "core" prices power fell to 1.5% on both a
twelve and three-month basis, down from a high of 2.9% during the
summer of 2006.
Let's look at five market-based harbingers of future inflation.
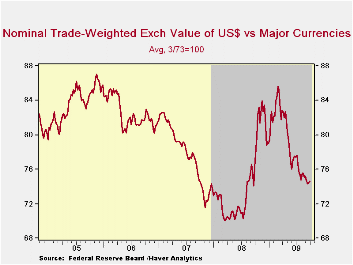
 First, the dollar is an indicator of a potential inflationary
threat in that it raises the prices of imported goods relative to
domestically made products. The dollar has been under significant
pressure recently as the weak U.S. economy has forced the Federal
Reserve to lower interest rates to near-zero from above 5% in 2007.
Certainly, recessions abroad have forced rates lower there as well. The
declines, however, have been not as large as in the U.S.
First, the dollar is an indicator of a potential inflationary
threat in that it raises the prices of imported goods relative to
domestically made products. The dollar has been under significant
pressure recently as the weak U.S. economy has forced the Federal
Reserve to lower interest rates to near-zero from above 5% in 2007.
Certainly, recessions abroad have forced rates lower there as well. The
declines, however, have been not as large as in the U.S.
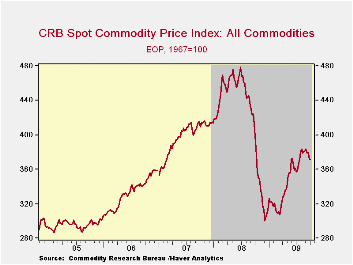
Next, gold & commodity prices give signals of potential inflationary threats. They do not feed directly significantly into product prices, but rather they can be a measure of the market's inflationary psychology. To that end, gold recently has jumped to a record $1,040 per ounce, up 14% y/y. Copper prices also have been strong. They have doubled since December while aluminum prices have risen by one-half.
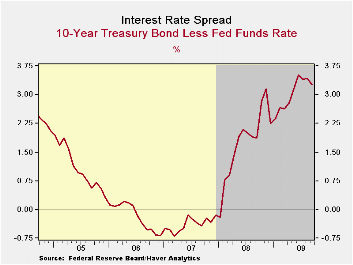
The interest rate
yield curve gives yet another reading of inflationary psychology in the
credit market. Following inversion as recently as late-2007 the spread
has widened to over 300 basis points, though it recently has narrowed
slightly. Also providing an indication of inflationary risk is the
market for TIPS, or Treasury inflation-protected securities. Recently,
that signal has stabilized after a sharp upturn this spring. From the
U.S. Federal Reserve, two papers discuss the value of TIPS. One, The
TIPS Yield Curve and Inflation Compensation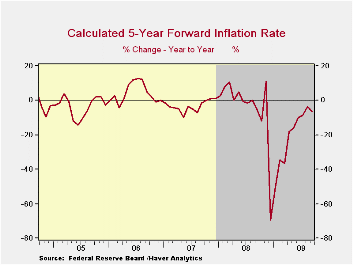
Money supply growth also can fuel inflation, directly through a heightened demand for goods and services, or just through increased liquidity. The Fed raised the growth rate in M2 to nearly 20% in the aftermath of the crash in stock prices last year. Instead of spending, consumers have chosen to lift their savings to a 3-4% rate from one percent early last year. Lately, money growth has been scaled back radically to near zero or less. In tandem, growth in the monetary base has been dropped. Nevertheless, the liquidity provided earlier by the Fed has not been drained.
What is money being used for? A measure of the degree to which
money is being spent or that savings are being rebuilt is the velocity
of money, i.e., the ratio of GDP to the money supply. Here the message
is clear. Recent money creation is being used for personal liquidity
rather than spending power. The ratio recently continued its collapse
and fell to 8.6 from its high near 10.5 last year.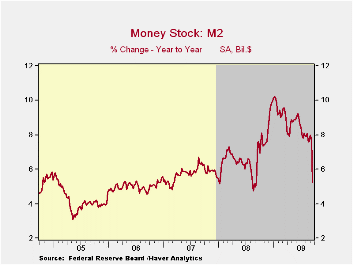 Velocity tends to
fall during periods of declining interest rates and the recent decline
has been to the lowest level since the recession of 2001.
Velocity tends to
fall during periods of declining interest rates and the recent decline
has been to the lowest level since the recession of 2001.
So far, the pieces of the puzzle suggest a coming problem of rising prices. What could diffuse this problem is a concerted effort by the Fed to rein in the growth of money. That may already have begun as indicated by no growth in M2 since the spring. However, that's only one of the above measures that points to a diminished inflationary threat. Thus, more aggressive action seems warranted. Recent speculation of the Fed delaying an interest rate increase until later next year is not encouraging.

Tom Moeller
AuthorMore in Author Profile »Prior to joining Haver Analytics in 2000, Mr. Moeller worked as the Economist at Chancellor Capital Management from 1985 to 1999. There, he developed comprehensive economic forecasts and interpreted economic data for equity and fixed income portfolio managers. Also at Chancellor, Mr. Moeller worked as an equity analyst and was responsible for researching and rating companies in the economically sensitive automobile and housing industries for investment in Chancellor’s equity portfolio. Prior to joining Chancellor, Mr. Moeller was an Economist at Citibank from 1979 to 1984. He also analyzed pricing behavior in the metals industry for the Council on Wage and Price Stability in Washington, D.C. In 1999, Mr. Moeller received the award for most accurate forecast from the Forecasters' Club of New York. From 1990 to 1992 he was President of the New York Association for Business Economists. Mr. Moeller earned an M.B.A. in Finance from Fordham University, where he graduated in 1987. He holds a Bachelor of Arts in Economics from George Washington University.
More Economy in Brief


