 Global| Sep 25 2008
Selected National Money Supplies
Summary
UK money supply is decelerating at the most rapid pace among our sample countries but its growth rate for real balances is still strong: 6.1% over 12 months and 11% (saar) over 3 months. Over the past year real EMU growth money is [...]
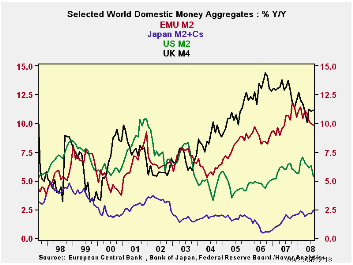
UK money supply is decelerating at the most rapid pace among our sample countries but its growth rate for real balances is still strong: 6.1% over 12 months and 11% (saar) over 3 months. Over the past year real EMU growth money is just about as strong as in the UK. The US shows substantial money supply deceleration and posts negative growth rates in real balances for horizons inside one year. The same is true of Japan.
In Europe credit to residents and overall loan growth are still strong and have hardly slowed. The slowing in real balances is more a function of rising inflation than of slowing credit.
While the credit crunch in the US has been more severe Europeans have created money at a much more rapid pace despite their insistence on a cap for overall money growth. Both the UK and the ECB have made a laughing stock of that ceiling rate.
Take my cap for money supply growth—Please! It’s like an old worn vaudeville joke.
In some quarters there are still concerns about accounting losses at European banks. US institutions are being hit harder and the impact is showing up in the money markets where trading has been seized up at various points. Growth is slowing everywhere and in Europe the news about slowing has been coming fast and furious. For the US the long standing bad news is getting a bit worse. Despite appearances European growth will slow a lot more and the ECB will be in dilemma over what to do with inflation and money growth still so high. It is interesting to note that the US central bank cut rates more aggressively yet has kept money supply growth in check much better than has Europe.
| Look at Global and Euro Liquidity Trends | |||||||
|---|---|---|---|---|---|---|---|
| Saar-all | Euro Measures (EA15): Money & Credit | G-10 Major Markets: Money | Memo | ||||
| €€-Supply M2 | Credit:Resid | Loans | $US M2 | ££UK M4 | ¥¥Jpn M2+Cds | OIL:WTI | |
| 3-MO | 7.4% | 9.0% | 6.0% | 1.5% | 17.8% | 2.9% | -23.5% |
| 6-MO | 8.3% | 9.1% | 7.4% | 3.5% | 12.5% | 1.8% | 52.4% |
| 12-MO | 9.8% | 11.1% | 8.9% | 5.4% | 11.2% | 2.4% | 61.3% |
| 2Yr | 10.3% | 11.2% | 9.9% | 5.9% | 12.4% | 2.1% | 26.5% |
| 3Yr | 9.6% | 11.4% | 10.3% | 5.5% | 12.8% | 1.6% | 21.7% |
| Real Balances: deflated by Own CPI. Oil deflated by US CPI | |||||||
| 3-MO | 5.1% | 6.6% | 3.7% | -5.3% | 11.0% | -1.5% | -28.6% |
| 6-MO | 4.9% | 5.7% | 4.1% | -2.4% | 6.7% | -1.4% | 43.7% |
| 12-MO | 5.8% | 7.0% | 4.8% | 0.0% | 6.1% | 0.2% | 53.1% |
| 2Yr | 7.3% | 8.2% | 6.9% | 2.2% | 8.9% | 1.1% | 22.1% |
| 3Yr | 6.8% | 8.6% | 7.5% | 1.7% | 9.5% | 0.6% | 17.3% |

Robert Brusca
AuthorMore in Author Profile »Robert A. Brusca is Chief Economist of Fact and Opinion Economics, a consulting firm he founded in Manhattan. He has been an economist on Wall Street for over 25 years. He has visited central banking and large institutional clients in over 30 countries in his career as an economist. Mr. Brusca was a Divisional Research Chief at the Federal Reserve Bank of NY (Chief of the International Financial markets Division), a Fed Watcher at Irving Trust and Chief Economist at Nikko Securities International. He is widely quoted and appears in various media. Mr. Brusca holds an MA and Ph.D. in economics from Michigan State University and a BA in Economics from the University of Michigan. His research pursues his strong interests in non aligned policy economics as well as international economics. FAO Economics’ research targets investors to assist them in making better investment decisions in stocks, bonds and in a variety of international assets. The company does not manage money and has no conflicts in giving economic advice.
More Economy in Brief


