 Global| Mar 25 2009
Rise in U.S. Durable Goods Orders Surprises
by:Tom Moeller
|in:Economy in Brief
Summary
New orders for durable goods rose a surprising 3.4% last month after a revised 7.3% January decline that was deeper than reported initially. Despite the latest increase, new orders have fallen by roughly one quarter since the middle [...]
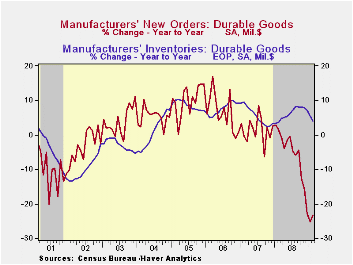
New orders for durable goods rose a surprising 3.4% last month after a revised 7.3% January decline that was deeper than reported initially. Despite the latest increase, new orders have fallen by roughly one quarter since the middle of last year; however, downward momentum in the level of bookings may have slackened. The latest increase compared to Consensus expectations for a 2.3% drop.
The unexpected rise in orders last month was not limited to any one sector. Machinery orders were the strongest and they posted a 13.5% rise (-13.1% y/y) which recovered the sharp downdraft during January. Orders for computers & related products followed with a 10.1% increase (-21.2% y/y). That erased the January drop. Orders for transportation equipment recouped their descent during January with a 2.0% increase. They remained off by nearly one-half from the year ago level. Still to the downside were February orders for new aircraft which dropped 3.6% and orders for motor vehicles & parts which fell by 0.6%. Orders for communications equipment also fell sharply.
There were glimmers of stability in other industries, too. Electrical equipment bookings rose 1.6% but that made up just a piece of a January drop. They're still down by one quarter from the year ago level.Primary metals orders ticked lower by just 0.6%.
Capital equipment orders recouped nearly all of their January
shortfall with an 11.0% rise. Nevertheless, they still are down by
one-quarter from last February. Orders for nondefense capital goods
made up their January decline but orders excluding aircraft recovered
just half the January down draft. During the last ten years there has
been an 80% correlation between the y/y change in nondefense capital
goods orders and the change in equipment & software spending in
the GDP accounts. The correlation of the GDP figure with capital goods
shipments is, as one would expect, a larger 92%.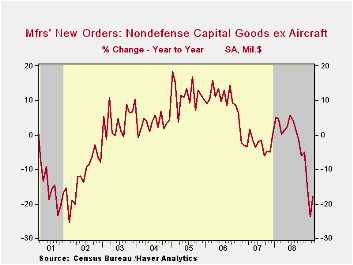
The rise in new orders was not accompanied by higher shipments of durable goods. They ticked 0.5% lower last month and are off 15.4% y/y. That year-to-year weakness has been accompanied by a 17.9% twelve-month decline in industrial production of durable goods. During the last ten years there has been an 83% correlation between the twelve-month change in shipments of durable goods and the change in durables industrial production.
Inventory accumulation has responded resoundingly to these production cuts. Inventories of manufactured durables fell 0.9% after a 1.1% January drop. But the last was just the second substantial monthly decline since 2003 suggesting that continued efforts to curb the inventories are waiting. Six-month growth was about flat and that compares to outright inventory decumulation at an 8.0% rate during the last recession.
The durable goods figures are available in Haver's USECON database.
| NAICS Classification (%) | February | January | Y/Y | 2008 | 2007 | 2006 |
|---|---|---|---|---|---|---|
| Durable Goods Orders | 3.4 | -7.3 | -23.4 | -5.8 | 1.4 | 6.2 |
| Excluding Transportation | 3.9 | -5.9 | -16.2 | -1.2 | -0.3 | 9.1 |
| Nondefense Capital Goods | 7.4 | -8.9 | -29.1 | -6.8 | 3.5 | 9.4 |
| Excluding Aircraft | 6.6 | -11.3 | -17.8 | -0.3 | -2.7 | 10.7 |
by Tom Moeller March 25, 2009
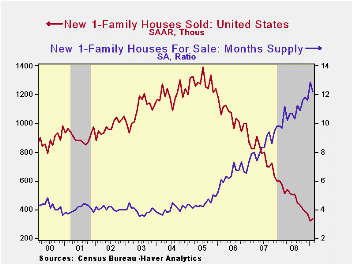
February sales of new single-family homes ticked up off their lowest level in the series' history. Their 4.7% month-to-month rebound to 337,000 units, nevertheless, left them down by roughly three-quarters from their peak during July 2005. February sales exceeded Consensus expectations for 300,000 units.
The February rebound in home sales was not broad based and limited to moderate increases in the South and the West. Home sales in the Midwest and in the Northeast continued lower.
Reflecting sales weakness was another decline in the median price for a new single-family home. At $200,900, the figure was off 11.6% during just the last two months and by nearly 20% since last year as homebuilders attempted to move inventory. Since their peak early in 2007, new home prices have fallen by roughly one quarter.
In fact, that effort to move homes continued successful and
the inventory of unsold homes is down by 43% since the peak during
2006. In each of the country's regions, the inventory is down by
one-quarter to one-third just during the last year.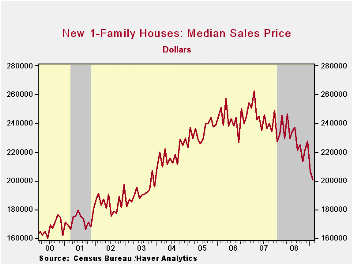
Despite the declines in inventory levels, the month's supply of new homes for sale remains high due to low sales. It ticked down just slightly during February from the record high to 12.2 months.
By range there have no sales of new homes priced over $750,000 during the last three months. There were 1,000 registered sales of a homes priced between $500,000 & $750,000 and 2,000 sales of homes priced between $400,000 and $500,000. These figures compare to sales between 3,000 and 8,000 of homes in the ranges below $400,000.
The new home sales figures are available in Haver's USECON database.
Today's House testimony by Fed Governor Elizabeth A. Duke titled Credit availability and prudent lending standards can be found here
| US New Homes | February | January | Y/Y (%) | 2008 | 2007 | 2006 |
|---|---|---|---|---|---|---|
| Total Sales (SAAR, 000s) | 337 | 332 | -41.1 | 479 | 768 | 1,049 |
| Northeast | 29 | 30 | -25.6 | 35 | 64 | 64 |
| Midwest | 50 | 55 | -35.1 | 69 | 118 | 161 |
| South | 193 | 176 | -38.5 | 264 | 408 | 559 |
| West | 65 | 61 | -54.2 | 111 | 178 | 266 |
| Median Price (NSA, $) | 200,900 | 206,800 | -18.1 | 230,217 | 243,742 | 243,067 |
by Robert Brusca March 25, 2009
The IFO Index fell again in March but the IFO expectations
index rose. Expectations are still only in the 16th percentile with
this ongoing bounce. The overall business climate and the current
situation indices are at lows.
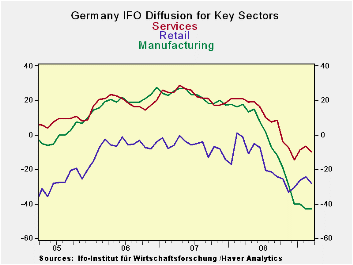
The chart above shows how some of the sector indices based on
diffusion indices are doing. All three pictured indices are falling
sharply. The services and retail sectors have made a small rebound.
Manufacturing is slowing its descent. Manufacturing and the all- sector
index (not pictures) are at the bottom of their range. The wholesaling
and services sectors (wholesaling not pictured) hover around the bottom
10% of their respective ranges. The retail sector is in the bottom 20%
of its range. Construction is nearly midrange, being far less affected
overall – so far.
On the month the manufacturing index ticked a bit lower.
Retailing, services and wholesaling moved a bit lower too. But
Construction showed higher diffusions reading. Contraction in there is
becoming less pronounced. And even though manufacturing deteriorated it
was by the slimmest of margins. In broad terms the IFO reading is in
agreement with the PMI sector indices from Market that show a reduction
in the rate of decline in both MFG and services.
Still, the news from IFO was not good and was not a positive
as some had hoped for. The upshot is that the report weighed on the
euro. However there might be enough evidence of an abatement in the
slowdown for Europe to call for additional stimulus. Today the EU’s
Junker was saying Europe would not simply cave into the US wishes for
more European stimulus because the economy’s spiral was still so
severe. But if the severe phase of the European downturn is abating, a
dollop of stimulus might be helpful. If Europe turns more to look at
the facts of its circumstance in stead of being disagreeable with the
US, it might find that the US urging is pushing it in the right
direction.
| IFO Survey: Germany | |||||||||
|---|---|---|---|---|---|---|---|---|---|
| Percent: Yr/Yr | Index Numbers | ||||||||
| Mar 09 |
Feb 09 |
Jan 09 |
Dec 08 |
Nov 08 |
Current | Feb 09 |
Curr/Avg | %tile | |
| Biz Climate | -21.5% | -20.6% | -19.7% | -20.0% | -17.8% | 82.1 | 82.6 | 85.5% | 0.0% |
| Current Situation | -25.8% | -23.5% | -19.7% | -18.1% | -14.2% | 82.7 | 84.3 | 86.2% | 0.0% |
| Biz Expectations | -16.9% | -17.5% | -19.8% | -22.0% | -21.3% | 81.6 | 80.9 | 84.8% | 16.3% |
| average & range since | Jun-91 | ||||||||

Tom Moeller
AuthorMore in Author Profile »Prior to joining Haver Analytics in 2000, Mr. Moeller worked as the Economist at Chancellor Capital Management from 1985 to 1999. There, he developed comprehensive economic forecasts and interpreted economic data for equity and fixed income portfolio managers. Also at Chancellor, Mr. Moeller worked as an equity analyst and was responsible for researching and rating companies in the economically sensitive automobile and housing industries for investment in Chancellor’s equity portfolio. Prior to joining Chancellor, Mr. Moeller was an Economist at Citibank from 1979 to 1984. He also analyzed pricing behavior in the metals industry for the Council on Wage and Price Stability in Washington, D.C. In 1999, Mr. Moeller received the award for most accurate forecast from the Forecasters' Club of New York. From 1990 to 1992 he was President of the New York Association for Business Economists. Mr. Moeller earned an M.B.A. in Finance from Fordham University, where he graduated in 1987. He holds a Bachelor of Arts in Economics from George Washington University.
More Economy in Brief


