 Global| Dec 04 2002
Revised Productivity Growth Stronger in 3Q
by:Tom Moeller
|in:Economy in Brief
Summary
Nonfarm labor productivity last quarter was revised up more than expected. Consensus estimates were for a revision to 4.3%. A large upward revision to output, following the upward revision to GDP growth, was the source of the upward [...]
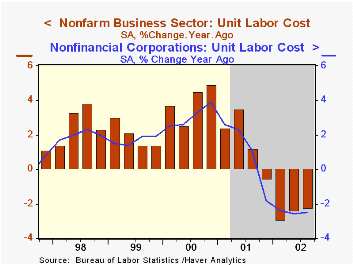
Nonfarm labor productivity last quarter was revised up more than expected. Consensus estimates were for a revision to 4.3%.
A large upward revision to output, following the upward revision to GDP growth, was the source of the upward revision. Output was revised to 5.1% growth from 4.0% (AR). Hours worked were unchanged in 3Q, as reported last month.
Unit Labor costs were revised down, declining for the fourth quarter in the last five. Compensation growth was little changed from the earlier report of strong growth.
Manufacturing sector productivity was revised down slightly to 5.5% (5.8% y/y) from 5.9% . Nevertheless, unit labor costs fell 1.0% (-2.1% y/y), the fifth consecutive quarterly decline.
Productivity in the nonfinancial corporate sector, a figure derived from the income side of the National Income and Product Accounts, grew 5.7% (6.7% y/y). Unit labor costs were unchanged (-2.5% y/y).
| Nonfarm Business Sector (SAAR) | 3Q '02 Final | 3Q '02 Prelim. | 2Q '02 | Y/Y | 2001 | 2000 | 1999 |
|---|---|---|---|---|---|---|---|
| Output per Hour | 5.1% | 4.0% | 1.7% | 5.6% | 1.1% | 2.9% | 2.4% |
| Compensation | 4.9% | 4.8% | 3.9% | 3.3% | 2.7% | 6.9% | 4.4% |
| Unit Labor Costs | -0.2% | 0.8% | 2.2% | -2.2% | 1.6% | 3.9% | 2.0% |
by Tom Moeller December 4, 2002
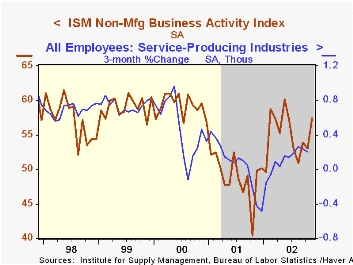
The Institute for Supply Management business activity index of the nonmanufacturing sector was much stronger than expected last month, rising to the highest level since May. Consensus expectations were for a slight increase to 54.0.
The overall index has remained above 50, the dividing line for expansion and contraction, since February.
Of the seasonally adjusted subgroups, new orders rose sharply and imports rose slightly, but employment fell.
The not seasonally adjusted index of prices was unchanged and was down versus the highs of earlier this year.
During the last five years, there has been a 62% correlation between the level of the NAPM nonmanufacturing index and the three month growth in service sector payrolls.
Business activity for the nonmanufacturing sector is a question separate from the subgroups mentioned above. In contrast, the NAPM manufacturing sector composite index weights the components.
ISM surveys more than 370 purchasing managers in more than 62 industries including construction, law firms, hospitals, government and retailers. The nonmanufacturing survey dates only to July 1997, therefore its seasonal adjustment should be viewed tentatively.
| ISM Nonmanufacturing Survey | Nov | Oct | Y/Y | 2001 | 2000 | 1999 |
|---|---|---|---|---|---|---|
| Business Activity Index | 57.4 | 53.1 | 49.8 | 49.0 | 59.2 | 59.1 |
by Tom Moeller December 4, 2002
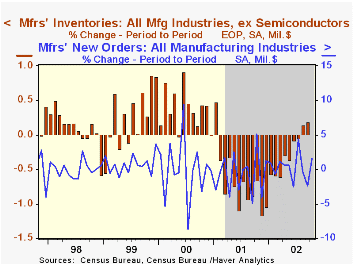
Manufacturing inventories were unchanged in October after rising September. The initial report for September was of no change. During the last three months, factory inventories have risen 0.3%.
Excluding the transportation sector inventory accumulation has been slightly stronger than for the total - unchanged in October but up 0.7% since June.
Increases in inventories continued to be led by the nondurable goods sector, up 2.6% during the last five months. Gains have been strong for petroleum, textile products, plastics and basic chemicals.
Decumulation in the durable goods sector continued unabated, down 0.2% m/m and 4.5% YTD. Declines have been widespread amongst industries.
Factory shipments rose 1.0% following two months of decline. For the year shipments have risen 3.0%. Gains have been strongest in nondurable goods industries (3.0% YTD), notably petroleum. Less petroleum, nondurable shipments were up 1.2% YTD in October. Prior months' figures were revised down. Shipments of durable goods rose a strong 1.3% in October (3.0% YTD.
Factory orders rose 1.5% following two months of decline led by higher orders for durable goods, up 2.4% and revised from the advance report of a 2.8% gain. The strong 4.5% rise in nondefense capital goods was little revised.
| Inventories | Oct | Sept | Y/Y | 2001 | 2000 | 1999 |
|---|---|---|---|---|---|---|
| Mfg Inventories | 0.0% | 0.2% | -4.4% | -8.0% | 4.5% | 3.1% |

Tom Moeller
AuthorMore in Author Profile »Prior to joining Haver Analytics in 2000, Mr. Moeller worked as the Economist at Chancellor Capital Management from 1985 to 1999. There, he developed comprehensive economic forecasts and interpreted economic data for equity and fixed income portfolio managers. Also at Chancellor, Mr. Moeller worked as an equity analyst and was responsible for researching and rating companies in the economically sensitive automobile and housing industries for investment in Chancellor’s equity portfolio. Prior to joining Chancellor, Mr. Moeller was an Economist at Citibank from 1979 to 1984. He also analyzed pricing behavior in the metals industry for the Council on Wage and Price Stability in Washington, D.C. In 1999, Mr. Moeller received the award for most accurate forecast from the Forecasters' Club of New York. From 1990 to 1992 he was President of the New York Association for Business Economists. Mr. Moeller earned an M.B.A. in Finance from Fordham University, where he graduated in 1987. He holds a Bachelor of Arts in Economics from George Washington University.
More Economy in Brief


