 Global| Sep 12 2003
Retail Sales Rose Less Than Expected Due to Autos
by:Tom Moeller
|in:Economy in Brief
Summary
Retail sales rose 0.6% in August. That was much less than the Consensus expectation for a 1.2% gain. July sales were revised to show a 1.3% gain versus 1.4% reported initially. Motor vehicle dealers' sales rose just 0.5% m/m in July. [...]
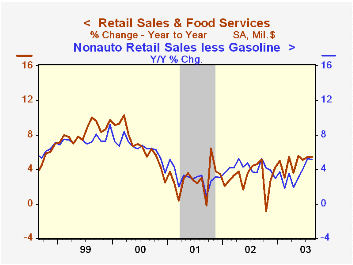
Retail sales rose 0.6% in August. That was much less than the Consensus expectation for a 1.2% gain. July sales were revised to show a 1.3% gain versus 1.4% reported initially.
Motor vehicle dealers' sales rose just 0.5% m/m in July. That was much less than the 9.6% gain in unit sales of light vehicles to 19.0 mil. (AR). Sales at gasoline service stations rose 2.7% (8.5% y/y).
Sales excluding motor vehicles and parts dealers were quite firm, up 0.7% and July sales were revised up to a 1.0% gain from 0.8%. Consensus expectations were for a 0.7% rise in August.
Furniture, home furnishing and electronics store sales increased 1.0% (8.7% y/y) following similarly strong (or stronger) gains in four of the prior five months. Sales at general merchandise stores rose 1.1%% (6.1% y/y) and were up at a 7.9% annual rate YTD.Apparel and accessory stores bucked the trend and fell 1.4% (4.0% y/y) following strong gains in four of the prior five months.
| Aug | July | Y/Y | 2002 | 2001 | 2000 | |
|---|---|---|---|---|---|---|
| Retail Sales & Food Services | 0.6% | 1.3% | 5.4% | 3.1% | 2.9% | 6.7% |
| Excluding Autos | 0.7% | 1.0% | 6.0% | 3.7% | 2.9% | 7.4% |
by Tom Moeller September 12, 2003
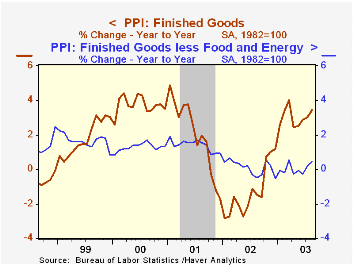
Finished producer prices rose 0.4% in August. That was slightly ahead of expectations for a 0.3% gain but the tame 0.1% increase in prices excluding food & energy was as expected.
Finished energy prices firmed again last month, rising 1.2% (14.2% y/y). That strength was led by a 5.2% (20.8% y/y) gain in gasoline prices. Fuel oil prices also were strong, up 4.9% (21.5% y/y) although residential gas prices, down 2.7% (28.9% y/y), fell for the second consecutive month. These energy product price series are NSA.
Prices for capital equipment moderated from the strength of the prior month and rose only 0.1% (0.9% y/y). Core finished consumer goods prices were tame again, rising 0.1% (0.1% y/y) following a 0.1% July rise.
Intermediate goods prices rose 0.5% but the gain mostly reflected a 2.4% increase in energy prices. The 0.1% rise in core intermediate goods prices followed a like decline the prior month. The core intermediate price index was about unchanged versus March.
Crude goods prices fell 1.4% as energy prices fell for the second month, down 7.4% (38.2% y/y). core crude goods prices were firm, rising 3.7%. The rise mostly just offset a weak 0.8% gain the month earlier, but together the two months' gain was the strongest since February and likely an indicator of improved activity in the factory sector.
| Producer Price Index | Aug | July | Y/Y | 2002 | 2001 | 2000 |
|---|---|---|---|---|---|---|
| Finished Goods | 0.4% | 0.1% | 3.4% | -1.3% | 2.0% | 3.7% |
| Core | 0.1% | 0.2% | 0.4% | 0.1% | 1.4% | 1.3% |
| Intermediate Goods | 0.5% | 0.2% | 4.4% | -1.5% | 0.4% | 4.9% |
| Core | 0.1% | -0.1% | 1.8% | -0.5% | -0.1% | 2.6% |
| Crude Goods | -1.4% | -2.9% | 20.9% | -10.6% | 0.3% | 22.9% |
| Core | 3.7% | 0.8% | 8.3% | 3.9% | -10.0% | 7.4% |
by Tom Moeller September 12, 2003
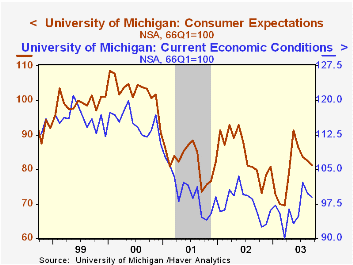
The University of Michigan’s consumer sentiment index fell unexpectedly in mid September. The decline to 88.2 from 89.3 in August was versus Consensus expectations for a reading of 90.0.
During the last five years there has been an 83% correlation between the level of consumer sentiment and the y/y% change in real PCE.
The Index of Consumer Expectations fell for the fourth consecutive month to the lowest level since April.
The read of Current Economic Conditions fell for the second month but remained firm relative to the deterioration in expectations.
The University of Michigan survey is not seasonally adjusted.It is based on telephone interviews with 250 households nationwide on personal finances and business and buying conditions. The survey is expanded to a total of 500 interviews at month end.
| University of Michigan | Mid-Sept | Aug | July | 2002 | 2001 | 2000 |
|---|---|---|---|---|---|---|
| Consumer Sentiment | 88.2 | 89.3 | 90.0 | 89.6 | 89.2 | 107.6 |

Tom Moeller
AuthorMore in Author Profile »Prior to joining Haver Analytics in 2000, Mr. Moeller worked as the Economist at Chancellor Capital Management from 1985 to 1999. There, he developed comprehensive economic forecasts and interpreted economic data for equity and fixed income portfolio managers. Also at Chancellor, Mr. Moeller worked as an equity analyst and was responsible for researching and rating companies in the economically sensitive automobile and housing industries for investment in Chancellor’s equity portfolio. Prior to joining Chancellor, Mr. Moeller was an Economist at Citibank from 1979 to 1984. He also analyzed pricing behavior in the metals industry for the Council on Wage and Price Stability in Washington, D.C. In 1999, Mr. Moeller received the award for most accurate forecast from the Forecasters' Club of New York. From 1990 to 1992 he was President of the New York Association for Business Economists. Mr. Moeller earned an M.B.A. in Finance from Fordham University, where he graduated in 1987. He holds a Bachelor of Arts in Economics from George Washington University.
More Economy in Brief


