 Global| Oct 15 2003
Retail Sales Fell Slightly, Excl. Autos Firm
by:Tom Moeller
|in:Economy in Brief
Summary
Retail sales fell a sight 0.2% last month. That was near Consensus expectations for no change. The surge in August sales was revised down slightly to 1.2% but July's gain was revised up to 1.4%. Motor vehicle dealers' sales fell 1.6% [...]
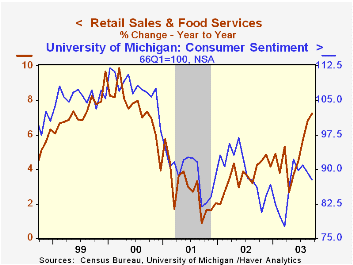
Retail sales fell a sight 0.2% last month. That was near Consensus expectations for no change. The surge in August sales was revised down slightly to 1.2% but July's gain was revised up to 1.4%.
Motor vehicle dealers' sales fell 1.6% m/m in September as unit sales of light vehicles fell 12.0% m/m to 16.7 mil. (AR). Sales at gasoline service stations rose 0.3% (9.3% y/y).
Sales excluding motor vehicles and parts dealers added 0.3% last month to huge 1.2% gains in each of the prior three months, the August increase revised up from 0.7%. Consensus expectations were for a 0.4% rise in September.
Apparel and accessory stores surged 1.4% (8.7% y/y) and the previously reported large decline in August was revised to just -0.3%. Furniture, home furnishing and electronics store sales fell 0.3% (7.2% y/y) following an unrevised 1.0% August gain. Sales at general merchandise stores added 0.3% (7.1% y/y) to huge gains in the prior four months.
Sales of building materials jumped 1.9% (11.4% y/y), the third large m/m gain in the last four months. The initial report of a 0.2% decline in August sales was revised to a 0.5% gain.
Another source for the large upward revision to nonauto retail sales in August was sales at food services & drinking places which now show a 2.0% increase versus 1.4% reported initially. These sales fell 1.4% last month.
| Sept | Aug | Y/Y | 2002 | 2001 | 2000 | |
|---|---|---|---|---|---|---|
| Retail Sales & Food Services | -0.2% | 1.2% | 7.5% | 3.1% | 2.9% | 6.7% |
| Excluding Autos | 0.3% | 1.2% | 7.2% | 3.7% | 2.9% | 7.4% |
by Tom Moeller October 15, 2003
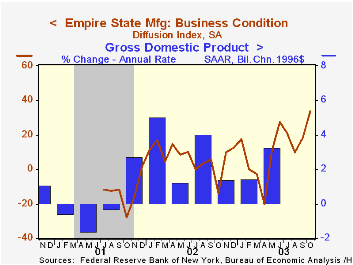
The Empire State Index of General Business Conditions for October jumped unexpectedly to the highest level in the index's brief two year history. The NY Fed's Manufacturing Survey indicated that the index rose to 33.70 this month versus Consensus expectations for a decline to 14.0.
Both the new orders and shipments indexes rose sharply to record levels in October. Employment also turned sharply higher with the first meaningfully positive reading since June 2002.
The index of prices paid reversed most of the September gain and fell to 6.86 from 15.60.
The survey includes measures of expectations for business conditions six months ahead. The October index rose to its highest level and expectations for capital expenditures also jumped to the highest level since September 2002.
The Empire State Manufacturing Survey is a monthly survey of manufacturers in New York State conducted by the Federal Reserve Bank of New York. Participants from across the state in a variety of industries respond to a questionnaire and report the change in a variety of indicators from the previous month. Respondents also state the likely direction of these same indicators six months ahead. April 2002 is the first report, although survey data date back to July 2001.
Like the Philadelphia Fed Index of General Business Conditions, the Empire State Business Conditions Index reflects answers to an independent survey question, not the components.
For more on the Empire State Manufacturing Survey, including methodologies and the latest report, click here.
| Empire State Manufacturing Survey | Oct | Sept | Y/Y | 2002 | 2001 |
|---|---|---|---|---|---|
| General Business Conditions (diffusion index) | 33.70 | 18.35 | -13.75 | 7.10 | -13.02 |
by Tom Moeller October 15, 2003
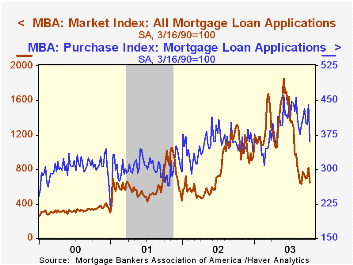
The index of mortgage applications compiled by the Mortgage Bankers Association plunged 20.5% last week to the lowest level since late August.
Purchase applications fell 18.6% w/w to the lowest level since March. The decline pulled the level in early October down 2.5% versus September.
During the last ten years there has been a 55% correlation between the y/y change in purchase applications and the change in new plus existing home sales.
Applications to refinance fell 22.1% w/w and more than gave back the prior week's increase. Applications to refinance are down nearly two-thirds y/y.
Interest rates on a conventional 30-Year mortgage held steady w/w at 6.10%. The effective rate on a 15-year mortgage also was steady at 5.47%.
The Mortgage Bankers Association surveys between 20 to 35 of the top lenders in the U.S. housing industry to derive its refinance, purchase and market indexes. The weekly survey accounts for more than 40% of all applications processed each week by mortgage lenders. Visit the Mortgage Bankers Association site here.
| MBA Mortgage Applications (3/16/90=100) | 10/10/03 | 10/03/03 | 2002 | 2001 | 2000 |
|---|---|---|---|---|---|
| Total Market Index | 649.6 | 817.3 | 799.7 | 625.6 | 322.7 |
| Purchase | 359.0 | 441.1 | 354.7 | 304.9 | 302.7 |
| Refinancing | 2,340.1 | 3,005.5 | 3,388.0 | 2,491.0 | 438.8 |

Tom Moeller
AuthorMore in Author Profile »Prior to joining Haver Analytics in 2000, Mr. Moeller worked as the Economist at Chancellor Capital Management from 1985 to 1999. There, he developed comprehensive economic forecasts and interpreted economic data for equity and fixed income portfolio managers. Also at Chancellor, Mr. Moeller worked as an equity analyst and was responsible for researching and rating companies in the economically sensitive automobile and housing industries for investment in Chancellor’s equity portfolio. Prior to joining Chancellor, Mr. Moeller was an Economist at Citibank from 1979 to 1984. He also analyzed pricing behavior in the metals industry for the Council on Wage and Price Stability in Washington, D.C. In 1999, Mr. Moeller received the award for most accurate forecast from the Forecasters' Club of New York. From 1990 to 1992 he was President of the New York Association for Business Economists. Mr. Moeller earned an M.B.A. in Finance from Fordham University, where he graduated in 1987. He holds a Bachelor of Arts in Economics from George Washington University.
More Economy in Brief


