 Global| Feb 24 2005
Renewed Strength in Australian Business Capital Spending
Summary
After a pause in Q3, capital spending in Australia rebounded in Q4, in data released this morning by the Australian Statistics Bureau in Canberra.* New capital expenditures of private business grew 5.7% (seasonally adjusted quarterly [...]
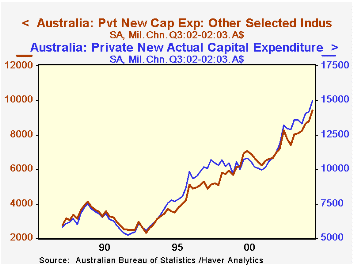
After a pause in Q3, capital spending in Australia rebounded in Q4, in data released this morning by the Australian Statistics Bureau in Canberra.* New capital expenditures of private business grew 5.7% (seasonally adjusted quarterly rate) compared with a minimal 0.6% gain the prior period. The data are reported in chained Australian dollars referenced in the 2002-2003 fiscal year.
By type of expenditure, growth in the latest quarter was stronger in purchases of equipment, up 6.5%. Outlays for buildings and structures gained 3.5%. At the same time, this construction work remains firm relative to total capital expenditures. Structures had ratcheted lower as a portion of the total from the mid-1987 inception of these data to mid-2002. Since then, they have risen modestly, as seen in the second graph. This doesn't necessarily mean that construction activity was "weak" in an absolute sense, but that equipment and machinery tended to grow more rapidly.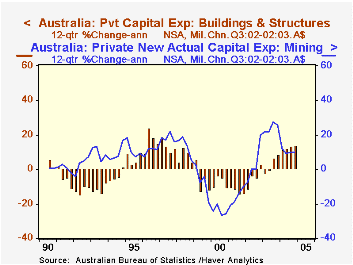
Further, the shift between structures and equipment outlays represents a shift in the structure of Australian industry. Mining and manufacturing were much more significant in 1987 when the Australian Bureau of Statistics began to collect these data. The mining sector did falter and carried down with it the construction of mine shafts and other associated structures. By contrast, "other selected industries" -- mostly business services, trade and travel -- expanded markedly, with a consequent spur to demand for business equipment. Once the adjustment in mining moderated, structures began to strengthen in both growth rate and share of total capital outlays.
[These data cover business-oriented industries; they exclude public services such as education, health and all government. For the relevant sectors, these capital expenditures are source data for fixed capital formation in GDP, but those national accounts data include more industries and types of outlays, such as net purchases of used assets.]
| Australia Business Capital Spending | Q4 2004 | Q3 2004 | Q4 2004/ Q4 2003 | 2004 | 2003 | 2002 |
|---|---|---|---|---|---|---|
| Total Capital Expenditures | 5.7 | 0.6 | 9.9 | 6.6 | 12.4 | 15.5 |
| Buildings & Structures | 3.5 | 0.5 | 10.3 | 11.6 | 17.8 | 9.1 |
| Equipment, Plant and Machinery | 6.5 | 0.6 | 9.7 | 4.9 | 10.6 | 17.6 |
Carol Stone, CBE
AuthorMore in Author Profile »Carol Stone, CBE came to Haver Analytics in 2003 following more than 35 years as a financial market economist at major Wall Street financial institutions, most especially Merrill Lynch and Nomura Securities. She had broad experience in analysis and forecasting of flow-of-funds accounts, the federal budget and Federal Reserve operations. At Nomura Securities, among other duties, she developed various indicator forecasting tools and edited a daily global publication produced in London and New York for readers in Tokyo. At Haver Analytics, Carol was a member of the Research Department, aiding database managers with research and documentation efforts, as well as posting commentary on select economic reports. In addition, she conducted Ways-of-the-World, a blog on economic issues for an Episcopal-Church-affiliated website, The Geranium Farm. During her career, Carol served as an officer of the Money Marketeers and the Downtown Economists Club. She had a PhD from NYU's Stern School of Business. She lived in Brooklyn, New York, and had a weekend home on Long Island.
More Economy in Brief


