 Global| Sep 12 2006
Record U.S. Foreign Trade Deficit Swelled By Higher Oil Prices
by:Tom Moeller
|in:Economy in Brief
Summary
Higher oil prices helped boost the U.S. foreign trade deficit to a new record in July of $68.0B from an unrevised $64.8 B in June. Consensus expectations had been for a somewhat shallower deficit of $65.5B. Imports of goods & services [...]
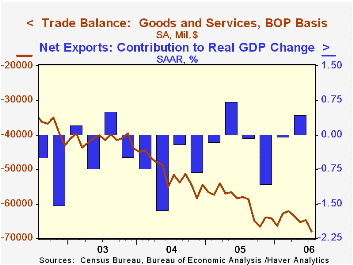
Higher oil prices helped boost the U.S. foreign trade deficit to a new record in July of $68.0B from an unrevised $64.8 B in June. Consensus expectations had been for a somewhat shallower deficit of $65.5B.
Imports of goods & services jumped 1.0% m/m driven higher by a 1.4% surge in goods imports. That gain was goosed by a 4.8% (36.5% y/y) spike in the value of petroleum imports as the price of imported crude oil rose 4.5% to $64.84 per bbl. (32.1% y/y). However, the quantity of crude petroleum imports fell 5.9% (+3.0% y/y).
Imports of nonpetroleum products rose 0.6% (11.1% y/y) as imports of capital goods increased 2.3% (11.8% y/y) but nonauto consumer goods imports rose just 0.5% (10.4% y/y). Automotive imports also fell 5.3% (+6.0% y/y) while imports of foods, feeds & beverages jumped 3.9% (11.1% y/y).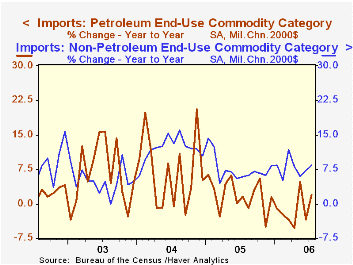
Total exports fell 1.1% after a 2.3% surge in June and a like gain in May. A 3.7% decline in capital goods exports (+11.1% y/y) pulled the July total lower along with a 0.5% (+16.8% y/y) slip in foods, feeds & beverages. Nearly half of the July decline in capital goods exports was due to lower civilian aircraft (-0.8% y/y). Exports of nonauto consumer goods posted another strong gain and rose 1.5% (14.3% y/y).
Services exports in July rose 0.1% (8.3% y/y) as private travel services exports rose just 0.5% (5.5% y/y). Imports of services declined 0.6% (+10.5% y/y).
The U.S. trade deficit in goods with China improved slightly to $19.6B in July ($201.5B in 2005).
| Foreign Trade | July | June | Y/Y | 2005 | 2004 | 2003 |
|---|---|---|---|---|---|---|
| U.S. Trade Deficit | $68.0B | $64.8B | $58.1B (7/05) |
$716.7B | $611.3B | $494.9B |
| Exports - Goods & Services | -1.1% | 2.3% | 12.6% | 10.7% | 13.4% | 4.2% |
| Imports - Goods & Services | 1.0% | 1.1% | 12.2% | 13.0% | 16.7% | 8.3% |
by Tom Moeller September 12, 2006
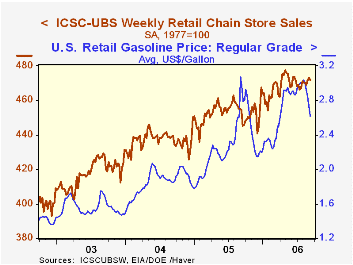
The International Council of Shopping Centers (ICSC)-UBS survey reported that chain store sales slipped 0.3% last week and reversed the prior period's gain.
Despite the backpedal, the average level of sales in September is up 0.5% from the August average. August sales rose 0.4% from July. During the last ten years there has been a 47% correlation between the y/y change in chain store sales and the change in nonauto retail sales less gasoline.The ICSC-UBS retail chain-store sales index is constructed using the same-store sales (stores open for one year) reported by 78 stores of seven retailers: Dayton Hudson, Federated, Kmart, May, J.C. Penney, Sears and Wal-Mart.
The leading indicator of chain store sales from ICSC-UBS jumped 0.6% (-1.5% y/y) in the latest week after moving sideways during most of August.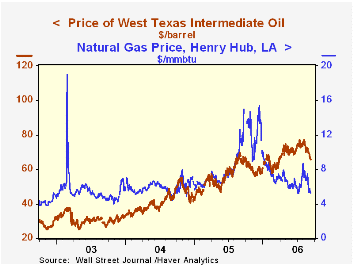 The retail price for a gallon of regular unleaded gasoline fell another eleven cents last week to an average $2.62 (-11.4% y/y), the lowest level since early April. In spot market trading yesterday regular unleaded gasoline prices held at $1.61 per gallon, down four cents from last week's average.
Oil prices slipped with the spot price of WTI crude down to $65.62 per bbl. (+3.6% y/y). Natural gas prices also slipped to $5.30/mmbtu (-50.7% y/y) in spot trading.
The retail price for a gallon of regular unleaded gasoline fell another eleven cents last week to an average $2.62 (-11.4% y/y), the lowest level since early April. In spot market trading yesterday regular unleaded gasoline prices held at $1.61 per gallon, down four cents from last week's average.
Oil prices slipped with the spot price of WTI crude down to $65.62 per bbl. (+3.6% y/y). Natural gas prices also slipped to $5.30/mmbtu (-50.7% y/y) in spot trading.
The latest Short-Term Energy Outlook from the U.S. Energy Information Administration is available here.
| ICSC-UBS (SA, 1977=100) | 09/09/06 | 09/02/06 | Y/Y | 2005 | 2004 | 2003 |
|---|---|---|---|---|---|---|
| Total Weekly Chain Store Sales | 471.8 | 473.2 | 3.8% | 3.6% | 4.7% | 2.9% |
by Tom Moeller September 12, 2006
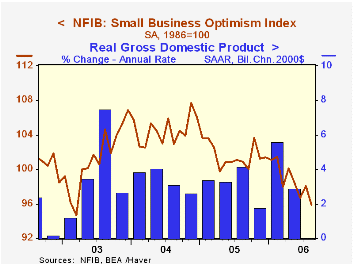
Small business optimism in August reversed all of the prior month's uptick and fell 2.2%, according to the National Federation of Independent Business (NFIB). At 95.9 the index was at its lowest level since March of 2003.
During the last ten years there has been a 70% correlation between the level of the NFIB index and the two quarter change in real GDP.
Respondents expecting the economy to improve fell moderately but the percentage expecting higher real sales in six months plunged.
The percentage of firms planning to increase employment improved to the highest level since January and the number of firms currently with one or more job openings rose slightly. During the last ten years there has been a 72% correlation between the NFIB percentage and the y/y change in nonfarm payrolls.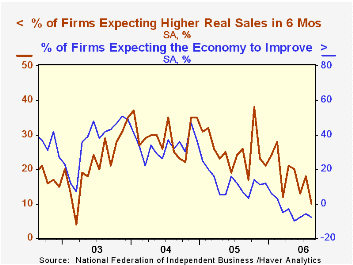
The percent planning to raise capital expenditures fell to 28%, below the 32% of last year..The percentage of firms planning to raise average selling prices slipped back to 29% and the percentage of firms actually raising prices also slipped to 22%. During the last ten years there has been a 60% correlation between the change in the producer price index and the level of the NFIB price index.
About 24 million businesses exist in the United States. Small business creates 80% of all new jobs in America.
Evolution of Retail Payments and the Role of the Federal Reserve, yesterday's speech by Federal Reserve Board Vice Chairman Donald L. Kohn, is available here.
| Nat'l Federation of Independent Business | August | July | Y/Y | 2005 | 2004 | 2003 |
|---|---|---|---|---|---|---|
| Small Business Optimism Index (1986=100) | 95.9 | 98.1 | -5.0% | 101.6 | 104.6 | 101.3 |
by Louise Curley September 12, 2006

Yesterday we reported a fall in Japanese machine orders in July. Today's releases of a rise in corporate goods prices (formerly wholesale prices) and a slight deterioration in consumer confidence in August are two more indicators that suggest that the outlook for Japan's economy is becoming less sanguine.
Corporate goods prices rose 0.6% from July to August and were 5.8% above August, 2005. The principal cause of the rise in the total index has been the prices of imported goods, particularly petroleum and metals. Prices of Chemicals and Related Goods rose 2.8% in the month of August and were 13.6% above August, 2005. The comparable figures for Metals and Related Products were 0.1% and 25.2%. The year to year increases in the total Corporate Goods Prices Index and the year to year increases in the price index of imported Metals and Related products is shown in the first chart.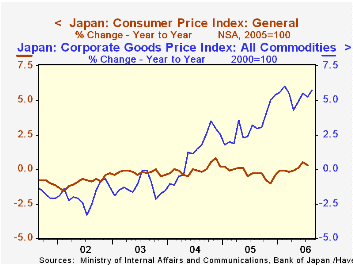
Apparently, Japanese businessmen have had trouble passing their rising costs on to the consumer. The second chart compares the year to year price increases in the Corporate Goods Price Index with those of the Consumer Price Index. It is clear that the increases in corporate prices have had little impact on the consumer prices. The inability to pass on higher costs will affect corporate profits negatively.
Consistent data on consumer confidence in Japan are available only from April, 2004 when the Economic and Social Research Institute of the Cabinet integrated the Consumer Confidence Survey, the Monthly Consumer Confidence Survey, and the One-person household Consumer Confidence Survey into the current survey. Consumer confidence is based on consumers' appraisals of their overall livelihood, income growth, employment, and willingness to purchase durable goods and is expressed in a diffusion index. Ever since the inception of the series, the index has remained below the 50 level, suggesting that, on balance, pessimists outweigh optimists. The index was 47.8 in August, down from 48.6 in July and from 48.4 in August, 2005. The available data are plotted in the third chart. It appears that the improvement in confidence that began in early 2005.may be at an end.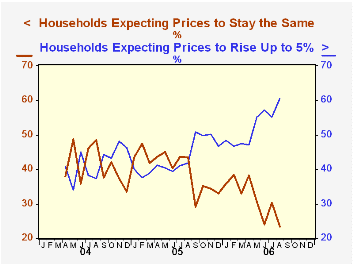
Although business seems to have trouble passing on its increased cost to consumers, a majority of consumers now expect prices to rise year from now. As shown in the third chart almost 60% of the households expect prices to rise up to 5% over the next year and 23.4% expect prices to remain unchanged. A year ago, in August, 2005, 41.8% expected prices to rise up to 5% and 43.4% expected prices to remain unchanged. In the chart we have added the percent of households expecting prices to rise up to 2% and those expecting prices to rise by more than 2%, but less than 5% and compared this series with the percent of households expecting prices to remain the same.
| Japan | Aug 06 | Jul 06 | Aug 05 | M/M% | Y/Y% | 2005 | 2004 | 2003 |
|---|---|---|---|---|---|---|---|---|
| Corporate Goods Prices (2000=100) | 106.6 | 106.0 | 100.8 | 0.87 | 5.75 | 100.1 | 97.1 | 96.0 |
| Domestic Prices | 101.5 | 101.3 | 98.2 | 0.20 | 3.36 | 97.7 | 96.1 | 94.9 |
| Export Prices | 104.0 | 103.3 | 98.4 | 0.68 | 5.69 | 98.3 | 95.4 | 97.8 |
| Import Prices | 143.1 | 140.2 | 120.8 | 2.07 | 18.46 | 118.0 | 104.3 | 100.1 |
| Chemical & Related Prices | 141.0 | 137.2 | 124.1 | 2.77 | 13.62 | 123.5 | 114.7 | 104.1 |
| Metals & Related Prices | 195.1 | 193.2 | 155.8 | 0.98 | 25.22 | 153.6 | 130.3 | 110.3 |
| Consumer Confidence (Diffusion Index) | 47.8 | 48.6 | 48.4 | -1.65 | -1.24 | 47.3 | n.a. | n.a. |

Tom Moeller
AuthorMore in Author Profile »Prior to joining Haver Analytics in 2000, Mr. Moeller worked as the Economist at Chancellor Capital Management from 1985 to 1999. There, he developed comprehensive economic forecasts and interpreted economic data for equity and fixed income portfolio managers. Also at Chancellor, Mr. Moeller worked as an equity analyst and was responsible for researching and rating companies in the economically sensitive automobile and housing industries for investment in Chancellor’s equity portfolio. Prior to joining Chancellor, Mr. Moeller was an Economist at Citibank from 1979 to 1984. He also analyzed pricing behavior in the metals industry for the Council on Wage and Price Stability in Washington, D.C. In 1999, Mr. Moeller received the award for most accurate forecast from the Forecasters' Club of New York. From 1990 to 1992 he was President of the New York Association for Business Economists. Mr. Moeller earned an M.B.A. in Finance from Fordham University, where he graduated in 1987. He holds a Bachelor of Arts in Economics from George Washington University.
More Economy in Brief


