 Global| Oct 14 2005
Record Gain in Energy Prices Lifted CPI; Core Prices Tame
by:Tom Moeller
|in:Economy in Brief
Summary
The consumer price index (CPI-U) was a bit stronger than Consensus expectations for a 0.9% rise last month. The 1.2% gain was the strongest for any month since 1980 and lifted the y/y increase to its strongest (4.7%) since 1991. [...]
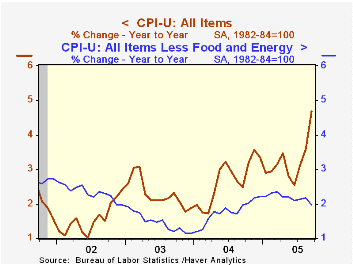
The consumer price index (CPI-U) was a bit stronger than Consensus expectations for a 0.9% rise last month. The 1.2% gain was the strongest for any month since 1980 and lifted the y/y increase to its strongest (4.7%) since 1991.
Higher energy prices continued to fuel the m/m increase and rose 12.0%, an all-time record. The 17.9% m/m rise in gasoline prices to an average $2.90 per gallon also was a record advance but prices have fallen slightly in October. Fuel oil prices also were strong, up 11.8% (46.0% y/y), while natural gas & electricity prices jumped 4.6% (13.5% y/y).
Prices less food & energy rose the same 0.1% as during the prior four months and again the gain was less than Consensus expectations for a 0.2% increase. Core goods prices rose 0.1% for the second consecutive month. Apparel prices fell 0.1% (-0.7% y/y) and most household furnishings prices fell as well. New vehicle prices rose 0.4% (0.7% y/y) and tobacco prices rose 0.7% (5.6% y/y).
Core services prices rose 0.1% for the second consecutive month as shelter prices fell 0.1% (+2.0% y/y) offset by a 0.3% (4.4% y/y) gain in medical care services prices. Public transportation prices rose 0.1% (7.5% y/y) for the second month and school tuition costs jumped 0.7% (6.3% y/y).
The chained CPI which adjusts for shifts in the mix of consumer purchases rose 0.8% and less food & energy chain prices rose 0.2%.
Update on the U.S. Economy and Fiscal Outlook, a speech made yesterday by Federal Reserve Board Governor Mark W. Olson, is available here.
| Consumer Price Index | Sept | Aug | Y/Y | 2004 | 2003 | 2002 |
|---|---|---|---|---|---|---|
| Total | 1.2% | 0.5% | 4.7% | 2.7% | 2.3% | 1.6% |
| Total less Food & Energy | 0.1% | 0.1% | 2.0% | 1.8% | 1.5% | 2.3% |
| Goods less Food & Energy | 0.1% | 0.1% | 0.6% | -0.9% | -2.0% | -1.1% |
| Services less Energy | 0.1% | 0.1% | 2.5% | 2.8% | 2.9% | 3.8% |
| Energy | 12.0% | 5.0% | 35.1% | 10.9% | 12.2% | -5.9% |
| Food | 0.3% | 0.0% | 2.5% | 3.4% | 2.1% | 1.8% |
| Chained CPI: Total (NSA) | 0.8% | 0.4% | 3.5% | 2.3% | 2.0% | 1.3% |
| Total less Food & Energy | 0.2% | 0.2% | 1.8% | 1.5% | 1.1% | 1.9% |
by Tom Moeller October 14, 2005
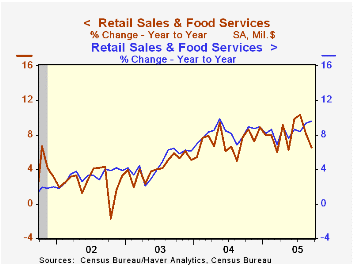
US retail sales rose 0.2% last month following a 1.9% August drop that was slightly shallower than initially reported. Consensus expectations had been for a 0.4% increase. Less autos, however, retail sales beat expectations for a 0.7% gain and increased 1.1% after an unrevised 1.0% August rise.
Sales at gasoline service stations surged 4.0%, about the same pace as during the prior three months, as the retail price of gasoline rose 16.8% m/m to an average $2.90 per gallon. So far in October gas prices have averaged $2.88.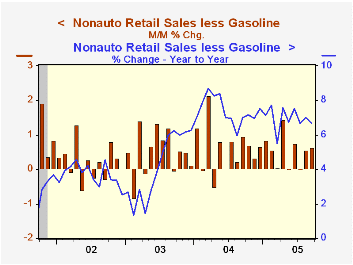
Less gasoline, nonauto retail sales rose the same 0.6% (6.7% y/y) as in August. The increase was boosted by a 1.0% (8.6% y/y) jump in building material sales which followed a 0.7% August rise.
Sales at furniture & electronics stores jumped 1.0% (7.2% y/y) after an upwardly revised 0.8% August increase. Sales of nonstore retailers (internet & catalogue) added 0.2% (11.1% y/y) to the prior month's 2.9% pop and general merchandise store sales rose 0.9% (6.8% y/y). Apparel store sales lagged the pace and fell 0.2% (+5.7% y/y).
Oil Prices and Consumer Spending from the Federal Reserve Bank of Richmond is available here.
| Sept | Aug | Y/Y | 2004 | 2003 | 2002 | |
|---|---|---|---|---|---|---|
| Retail Sales & Food Services | 0.2% | -1.9% | 6.5% | 7.3% | 4.3% | 2.5% |
| Excluding Autos | 1.1% | 1.0% | 9.6% | 8.3% | 4.7% | 3.3% |
by Tom Moeller October 14, 2005
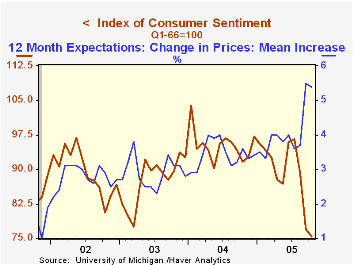
The preliminary October reading of consumer sentiment at 75.4 from the University of Michigan slipped 2.0% from September to the lowest level since 1992 and contrasted to Consensus expectations for improvement to 80.0.
During the last ten years there has been a 78% correlation between the level of consumer sentiment and the y/y change in real consumer spending.
The current conditions index fell 2.4% m/m (-8.0% y/y) as sentiment regarding buying conditions for large household goods fell 4.6% (-8.9% y/y) but the read of personal finances improved 1.0% m/m (-7.1% y/y).
Consumer expectations slipped 1.4% after two months of double digit decline. Expected personal finances fell 3.5% (-12.6% y/y) but expected business conditions during the next 12 months improved a slight 3.2% (-43.4% y/y).
The mean expected inflation rate for the next twelve months was about stable at 5.4% but still up from 3.4% during all of last year.
The University of Michigan survey is not seasonally adjusted.The mid-month survey is based on telephone interviews with 250 households nationwide on personal finances and business and buying conditions. The survey is expanded to a total of 500 interviews at month end.
| University of Michigan | October (Prelim.) | Sept | Y/Y | 2004 | 2003 | 2002 |
|---|---|---|---|---|---|---|
| Consumer Sentiment | 75.4 | 76.9 | -17.8% | 95.2 | 87.6 | 89.6 |
| Current Conditions | 95.7 | 98.1 | -8.0% | 105.6 | 97.2 | 97.5 |
| Consumer Expectations | 62.4 | 63.3 | -25.5% | 88.5 | 81.4 | 84.6 |
by Tom Moeller October 14, 2005
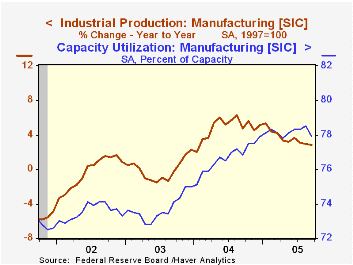
Industrial output last month fell 1.3% reflecting the effects of Hurricane's Katrina & Rita and the decline by far outpaced Consensus expectations for a 0.4% drop. Utility output (-0.9%) and mining output (-9.1%) again reflected the worst damage. Factory sector production fell a lesser 0.6% (+2.9% y/y).
The Federal Reserve indicated that storm-related production declines may have reduced the change in total industrial production about 1.7 percentage points and by nearly 0.4 percentage points in August. Additionally, the strike in the aircraft industry reduced the change in total industrial output by almost 0.5 percentage points.
Output of computers, peripheral equipment & semiconductors jumped 3.7% (24.6% y/y). Excluding the high tech sector factory output fell 0.9% (+1.6% y/y).
Output of appliances, furniture & carpeting rose 0.3% (4.1% y/y) but business equipment output dropped a sharp 3.7% reflecting a 24.3% drop in transit equipment and a 3.4% decline in defense & space.
Total capacity utilization fell sharply to 78.6% and capacity grew 1.1% y/y. Factory sector utilization fell to 77.9% while capacity rose 1.4% y/y.
| Production & Capacity | Sept | Aug | Y/Y | 2004 | 2003 | 2002 |
|---|---|---|---|---|---|---|
| Industrial Production | -1.3% | 0.2% | 2.0% | 4.1% | -0.0% | -0.3% |
| Consumer Goods | 0.3% | 0.5% | 3.6% | 2.7% | 0.3% | 1.4% |
| Business Equipment | -3.7% | -0.4% | 4.0% | 9.5% | 1.2% | -7.9% |
| Capacity Utilization | 78.6% | 79.8% | 78.0% (9/04) | 78.1% | 75.5% | 75.3% |
by Tom Moeller October 14, 2005
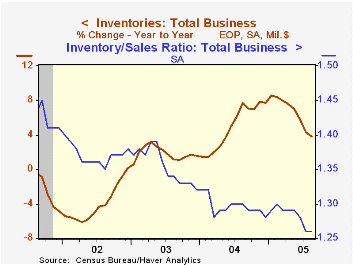
August total business inventories reversed the prior month's decline and rose 0.4%. The increase was double Consensus expectations, the first since May and the largest since March. Nevertheless, the ratio of inventories-to-sales remained at the record low of 1.26 due to a 0.4% (7.1% y/y) rise in business sales.
The 0.9% rise in retail inventories gained back half of the prior month's decline due to a 1.7% increase in motor vehicle inventories but excluding autos inventories jumped 0.6% (5.9% y/y). Furniture inventories fell 0.3% (+6.1% y/y) but general merchandise surged 1.3% (6.9% y/y).
Factory sector inventories fell slightly after a sharp 0.6% July gain.
Wholesale inventories increased 0.5%. During the last ten years there has been a 64% correlation between the y/y change in wholesale inventories and the change in imports of merchandise.
Economic Flexibility, a speech by Federal Reserve Chairman Alan Greenspan, is available here.
| Business Inventories | Aug | July | Y/Y | 2004 | 2003 | 2002 |
|---|---|---|---|---|---|---|
| Total | 0.4% | -0.4% | 3.8% | 7.7% | 1.4% | 1.6% |
| Retail | 0.9% | -1.8% | -0.4% | 5.7% | 3.9% | 5.9% |
| Retail excl. Autos | 0.6% | -0.0% | 5.9% | 5.9% | 2.0% | 2.3% |
| Wholesale | 0.5% | 0.1% | 7.7% | 10.8% | 2.0% | 1.2% |
| Manufacturing | -0.1% | 0.6% | 5.3% | 7.7% | -1.1% | -5.4% |
by Carol Stone October 14, 2005
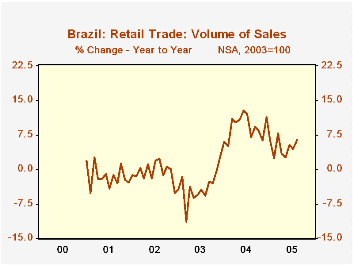
Retail trade in Brazil decreased slightly in August, according to data reported this morning by Brazil's Institute of Geography and Statistics (IBGE). The total value of sales, seasonally adjusted, eased 0.3% from July, and the volume of sales was down by 0.4%. However, press reports highlighted a stronger move in year-on-year growth. Sales volume, not seasonally adjusted, was up 6.5% from August 2004, the best such performance since March.
The strongest sectors included furniture and appliances and computers and peripherals. Supermarket and food store sales are expanding less than they did last year. Fuel outlets have also seen persistent declines in volume this year -- on a year-over-year basis -- but the August figure, at -6.0%, was the smallest of these decreases. Notably, a price deflator for the fuel category calculated from the value and volume indexes was slowing through August, suggesting that the reduced volume of fuel purchases was not a direct response to accelerating prices. This may have changed in September, however.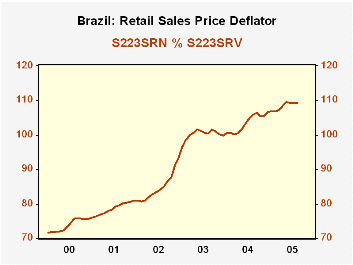
The general price situation in Brazilian retail sales continues to look favorable. A broad deflator based on the ratio of total value to total volume of sales stood at only 109.3 in August, an annualized increase of 4.5% from the middle of 2003, the base period for these data. Moreover, this index has been virtually flat for four months, and if calculated from raw data before seasonal adjustment, it has been declining mildly in the latest months. This sluggish tendency is a far cry from the double- digit pace that prevailed as recently as 2003. Again, as with fuel prices themselves, this result may have deteriorated in September as world energy prices surged. Even so, the moderation of inflation can only help the underlying health of Brazil's consumers and overall economy.
| Brazil: Index, 2003=100 |
Aug 2005* | July 2005* | Aug 2004* | 2004 | 2003 | 2002 |
|---|---|---|---|---|---|---|
| Retail Sales Value | 125.52 | 125.92 | 115.84 | 113.13 | 100.14 | 88.30 |
| % Change | -0.3 | 0.3 | 10.0 | 13.0 | 13.4 | 7.3 |
| Retail Sales Volume | 114.84 | 115.27 | 109.47 | 109.25 | 100.00 | 103.81 |
| % Change | -0.4 | 0.2 | 6.5 | 9.2 | -3.7 | -0.7 |
| Implicit Price Index** | 109.30 | 109.24 | 105.82 | 103.36 | 100.11 | 84.77 |
| % Change | 0.1 | 0.0 | 3.3 | 3.2 | 18.1 | 7.9 |

Tom Moeller
AuthorMore in Author Profile »Prior to joining Haver Analytics in 2000, Mr. Moeller worked as the Economist at Chancellor Capital Management from 1985 to 1999. There, he developed comprehensive economic forecasts and interpreted economic data for equity and fixed income portfolio managers. Also at Chancellor, Mr. Moeller worked as an equity analyst and was responsible for researching and rating companies in the economically sensitive automobile and housing industries for investment in Chancellor’s equity portfolio. Prior to joining Chancellor, Mr. Moeller was an Economist at Citibank from 1979 to 1984. He also analyzed pricing behavior in the metals industry for the Council on Wage and Price Stability in Washington, D.C. In 1999, Mr. Moeller received the award for most accurate forecast from the Forecasters' Club of New York. From 1990 to 1992 he was President of the New York Association for Business Economists. Mr. Moeller earned an M.B.A. in Finance from Fordham University, where he graduated in 1987. He holds a Bachelor of Arts in Economics from George Washington University.
More Economy in Brief


