 Global| Aug 28 2006
Railcar Loadings, Truck Tonnage & Air Freight
by:Tom Moeller
|in:Economy in Brief
Summary
Railcar loadings through July grew 2.7% y/y, according to Atlantic Systems. Though y/y growth has been firm, the six month growth in loadings eased to 1.4% though some pickup may be evident in the weekly data for August. Intermodal [...]
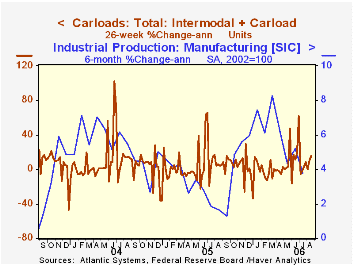
Railcar loadings through July grew 2.7% y/y, according to Atlantic Systems. Though y/y growth has been firm, the six month growth in loadings eased to 1.4% though some pickup may be evident in the weekly data for August.
Intermodal loadings (containers & trailers on flat cars) grew 5.4%. That rate of growth is roughly half the rate during 2004 and is down from 7.0% last year. Carload tonnage (which includes bulk shipping of materials) grew 0.8% y/y after a slight decline last year and 1.8% growth in 2004.
During the last ten years there has been a 37% correlation between the y/y growth in total freight car loadings and the change in factory production.
The truck tonnage index from the American Trucking Association fell 1.6% y/y during July. The index level improved some 3.0% from a low in March, but forward momentum has been constrained since last year's highs.
During the last ten years there has been a 44% correlation between the y/y growth in the truck tonnage index and the change in factory production.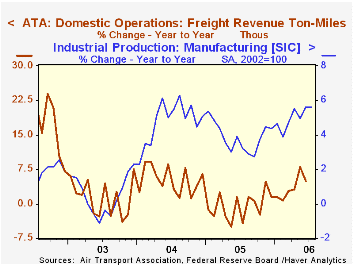
Air Freight Revenue Ton-Miles generated within the U.S. grew 5.0% y/y through June, according to the Air Transport Association. That growth is quite respectable but much of its strength owes to a favorable comparison to a weak period last year. The six-month growth rate of U.S. air-freight dropped to a negative 7.5%.
During the last ten years there has been a 38% correlation between the y/y growth in Air Freight and the change in factory production.
Chairman Ben S. Bernanke remarks at the Kansas City Fed's Annual Economic Symposium in Jackson Hole, Wyoming can be found here.
| U.S. Industry Statistics (Y/Y % Change) | July | June | May | 2005 | 2004 | 2003 |
|---|---|---|---|---|---|---|
| Railcar Loadings | 2.7% | 5.9% | 5.4% | 2.5% | 4.8% | 2.5% |
| Truck Tonnage Index | -1.6% | -1.1% | -1.2% | 2.3% | 5.9% | 3.0% |
| ATA Domestic Freight Revenue Ton-Miles | -- | 5.0% | 8.0% | -0.4% | 5.2% | 1.2% |
by Louise Curley August 28, 2006

Estonia and Lithuania reported that average monthly wages in the second quarter were 14.96% and 14.12%, respectively, above the second quarter of 2005. Wage growth in Lithuania has been accelerating and this was the highest year-to-year increase to date.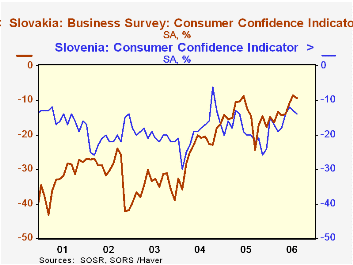 Wage growth in Estonia, on the other hand, had decelerated from 14.63% in the second quarter of 2001 to 7.26% in the second quarter of 2004, since then it has accelerated. The trends of wage growth in the two countries are shown in the first chart. To get some idea of the relative level of wages in the two countries we converted the wages in local currency into wages in euros. There are 15.646 Estonian Kroon in one Euro and 3.452 Lithuanian Litas in one Euro. In terms of euros the average monthly wage level in the second quarter of this year was 440 euros for Lithuania and 609.euros for Estonia.
Two other emerging countries of Europe, Slovenia and Slovakia reported the results of recent business surveys. The results are the excess of those who believe conditions will improve over those who believe conditions will worsen. Those participating in Slovakia's Industry Confidence Survey have generally shown an excess of optimists over pessimists, while those participating in Slovenia's Combined Confidence Indicator have had an excess of pessimists until November, 2005. Since then there has been an increasing excess of optimists as can be seen in the second chart. The disparity between the two surveys may be due to the fact that the Combined Confidence Indicator includes the opinions of consumers who until recently have been pessimistic whereas Slovakia's Industry Confidence Survey does not. In the third chart, we have plotted the Slovenia's Combined Confidence Indicator with the Consumer Component. It is clear that the consumer has had a negative effect on the combined index until recently.
| Q2 06 | Q1 06 | Q2 05 | Q/Q % | Y/Y % | 2005 % | 2004 % | 2003 % | |
|---|---|---|---|---|---|---|---|---|
| Monthly Wage NAS | ||||||||
| Estonia (Kroon) | 9531 | 8591 | 8291 | 2.96 | 14.96 | 11.94 | 7.71 | 9.64 |
| Estonia (Euro | 609 | -- | -- | -- | -- | -- | -- | -- |
| Lithuania (Litas) | 1519.7 | 14370 | 1331.5 | 5.76 | 14.13 | 10.02 | 5.71 | 4.41 |
| Lithuania (Euro) | 440 | -- | -- | -- | -- | -- | -- | -- |
| Aug 06 | Jul 06 | Aug 05 | Q/Q Dif | Y/Y Dif | 2005 Dif | 2004 Dif | 2003 Dif | |
| Measures of Confidence | ||||||||
| Slovakia Business Survey % Bal | 10.7 | 9.7 | -1.3 | 1.0 | 12.0 | 4.6 | 6.5 | 4.6 |
| Slovenia Combined Sentiment Indicator % Bal | 6 | 7 | -1 | -1 | 7 | -1 | -1 | -5 |
| Slovenia Consumer | -14 | -13 | -20 | -1 | 6 | -19 | -19 | -20 |

Tom Moeller
AuthorMore in Author Profile »Prior to joining Haver Analytics in 2000, Mr. Moeller worked as the Economist at Chancellor Capital Management from 1985 to 1999. There, he developed comprehensive economic forecasts and interpreted economic data for equity and fixed income portfolio managers. Also at Chancellor, Mr. Moeller worked as an equity analyst and was responsible for researching and rating companies in the economically sensitive automobile and housing industries for investment in Chancellor’s equity portfolio. Prior to joining Chancellor, Mr. Moeller was an Economist at Citibank from 1979 to 1984. He also analyzed pricing behavior in the metals industry for the Council on Wage and Price Stability in Washington, D.C. In 1999, Mr. Moeller received the award for most accurate forecast from the Forecasters' Club of New York. From 1990 to 1992 he was President of the New York Association for Business Economists. Mr. Moeller earned an M.B.A. in Finance from Fordham University, where he graduated in 1987. He holds a Bachelor of Arts in Economics from George Washington University.
More Economy in Brief


