 Global| Oct 29 2009
Q3 GDP Posts First Gain AfterMore-Than Year Long Recession
by:Tom Moeller
|in:Economy in Brief
Summary
The U.S. economy grew last quarter at hardly a barn-burning rate, but at least it was positive for the first time in over a year. Real GDP during 3Q'09 grew at an expected 3.5% annual rate after a 3.7% decline since late-2007. The [...]
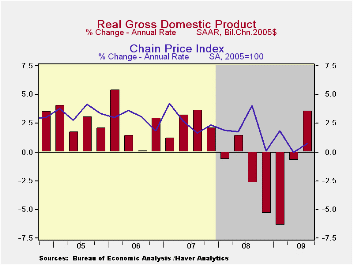
The U.S. economy grew last quarter at hardly a barn-burning rate, but at least it was positive for the first time in over a year. Real GDP during 3Q'09 grew at an expected 3.5% annual rate after a 3.7% decline since late-2007. The rise was fueled by upturns in domestic demand and inventories but lessened by deterioration in the foreign trade deficit. Consensus expectations are that economic growth will continue in coming quarters at roughly a 3.0% rate which, by postwar standards, would be subpar.
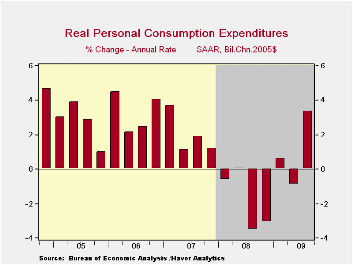 Domestic final demand growth was positive for just the second
quarter since 1Q'08. The upturn owed to a 3.1% gain in consumer
spending (-0.3% y/y) that was led by a 22.8% rise in durables
consumption. The Cash for Clunkers sales incentive program by
auto-makers caused motor vehicle consumption to jump at a 56.4% annual
rate, though it still was up just 1.4% from one-year earlier.
Elsewhere, personal consumption of furniture grew at a 6.4% (-5.9% y/y)
rate following a like downturn during 2Q. Spending on clothing
& shoes fell at a 1.5% (-5.1% y/y) rate while services spending
gained a modest 1.8% (0.4% y/y).
Domestic final demand growth was positive for just the second
quarter since 1Q'08. The upturn owed to a 3.1% gain in consumer
spending (-0.3% y/y) that was led by a 22.8% rise in durables
consumption. The Cash for Clunkers sales incentive program by
auto-makers caused motor vehicle consumption to jump at a 56.4% annual
rate, though it still was up just 1.4% from one-year earlier.
Elsewhere, personal consumption of furniture grew at a 6.4% (-5.9% y/y)
rate following a like downturn during 2Q. Spending on clothing
& shoes fell at a 1.5% (-5.1% y/y) rate while services spending
gained a modest 1.8% (0.4% y/y).
 In the fixed-investment side of the GDP accounts, residential
spending also grew for the first time since 1Q'06. The 23.3% rise
(-18.1% y/y) followed a 2Q decline of similar magnitude. During the
downturn, which spanned three years, residential investment fell by
more than one-half. Continuing to the downside at a 2.5% (-18.9% y/y)
rate was business investment. The decline was led by a 9.0% (-20.8%
y/y) drop in spending on structures though equipment spending rose a
modest 1.1% (-17.9% y/y). That increase was led by a gain in
transportation equipment spending (-47.2% y/y) and an upturn in
information processing equipment & software (-6.4% y/y).
Government investment rose at a 2.3% rate (1.8% y/y) led by a gain in
defense spending (5.0% y/y).
In the fixed-investment side of the GDP accounts, residential
spending also grew for the first time since 1Q'06. The 23.3% rise
(-18.1% y/y) followed a 2Q decline of similar magnitude. During the
downturn, which spanned three years, residential investment fell by
more than one-half. Continuing to the downside at a 2.5% (-18.9% y/y)
rate was business investment. The decline was led by a 9.0% (-20.8%
y/y) drop in spending on structures though equipment spending rose a
modest 1.1% (-17.9% y/y). That increase was led by a gain in
transportation equipment spending (-47.2% y/y) and an upturn in
information processing equipment & software (-6.4% y/y).
Government investment rose at a 2.3% rate (1.8% y/y) led by a gain in
defense spending (5.0% y/y).
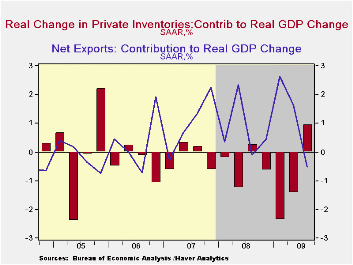
 Inventory accumulation made a positive contribution to GDP
growth for just the second time in two years. The modest 0.9% addition
followed subtractions of 1.4 and 2.4 percentage points during the prior
two quarters.
Inventory accumulation made a positive contribution to GDP
growth for just the second time in two years. The modest 0.9% addition
followed subtractions of 1.4 and 2.4 percentage points during the prior
two quarters.
For the first time in a year, deterioration in the foreign trade deficit lowered GDP growth. The 0.5 percentage point subtraction was due to a 16.3% (-14.9% y/y) rise in real imports which outpaced the 14.7% (-11.2% y/y) gain in exports.
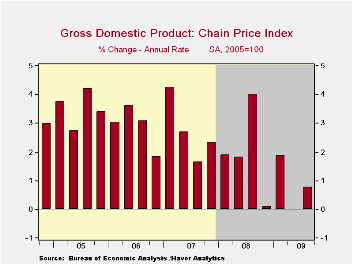
The GDP price deflator rose a slim 0.8%. Though the PCE price index gained 2.8% (-0.6% y/y), the rise in the overall domestic final sales price index was held to just 1.6% (-1.0% y/y) as the fixed investment price index fell sharply (-2.5% y/y).
| Chained 2005$, % AR | 3Q '09 | 2Q '09 | 1Q '09 | 2Q Y/Y | 2008 | 2007 | 2006 |
|---|---|---|---|---|---|---|---|
| GDP | 3.5 | -0.7 | -6.4 | -2.3 | 0.4 | 2.1 | 2.7 |
| Inventory Effect | 0.9 | -1.4 | -2.4 | -1.2 | -0.4 | -0.4 | 0.1 |
| Final Sales | 2.6 | 0.7 | -4.1 | -1.5 | 0.8 | 2.5 | 2.6 |
| Foreign Trade Effect | -0.5 | 1.7 | 2.6 | 0.9 | -1.2 | 0.8 | 0.1 |
| Domestic Final Demand | 3.0 | -0.9 | -6.4 | -2.4 | -0.4 | 1.7 | 2.5 |
| Chained GDP Price Index | 0.8 | -0.0 | 1.9 | 0.7 | 2.1 | 2.9 | 3.3 |
by Tom Moeller October 29, 2009
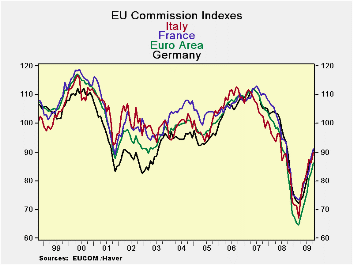
The EU Commission indices made their eight largest advance
Since October 1988 for the EU region as a whole. This boosted the
overall index for the EU to the 46th percentile of range much closer to
its midpoint but still 14% below its average level for the same period.
Surprisingly in relative terms it is the consumer that is
boosting the region the most. Consumer confidence stands at the 50%
mark of its range. Construction lags the most of all sectors, standing
in the 17th percentile of its range followed by services that languish
in the 31st percentile of their range. Both retailing and the
industrial sector are in their respective 41st percentiles.
As to countries, the large countries are clustered closely
together in their respective range readings. Spain is the weakest in
the 38th percentile of its range. Compared to the UK in the 47th range
percentile; among EMU members Italy is the relative strongest in its
42nd percentile leaving a small gap between the best reading and the
worst among large countries in the e-Zone.
Still if we look at the rankings by queue the results are much
weaker. The range ranking positions the current reading between the
highest and lowest range values. The queue orders the various readings
by component or country depending on its application. It ranks them
presenting the result as a percentage (100 is highest). The queue
percentiles show that while the various indicators have come sharply up
from their lows and some although some are closing in on range
midpoints the ranked readings are still no where near normal.
The overall EU reading that stands in the 46th percentile of
its range also stands in the 11th percentile of its queue – a terribly
low standing. The real message here is that yes there is a significant
recovery from the lows in gear but the current levels of the indices
are still well below normal.
While the EU and EMU regions are making progress there is
still a very long way to go.
| EU Sectors and Country level Overall Sentiment | |||||||||||
|---|---|---|---|---|---|---|---|---|---|---|---|
| EU | Oct 09 |
Sep 09 |
Aug 09 |
Jul 09 |
Percen -tile |
Rank | Max | Min | Range | Mean | By Queue Rank% |
| Overall Index | 86 | 82.6 | 81 | 75 | 46.0 | 222 | 116 | 60 | 56 | 99 | 11.6% |
| Industrial | -20 | -24 | -26 | -30 | 41.3 | 225 | 7 | -39 | 46 | -8 | 10.4% |
| Consumer Confidence | -15 | -17 | -20 | -21 | 50.0 | 188 | 2 | -32 | 34 | -11 | 25.1% |
| Retail Trade | -12 | -11 | -12 | -14 | 41.9 | 215 | 6 | -25 | 31 | -6 | 14.3% |
| Construction | -34 | -35 | -36 | -37 | 17.4 | 216 | 4 | -42 | 46 | -17 | 13.9% |
| Services | -11 | -11 | -11 | -19 | 31.7 | 143 | 32 | -31 | 63 | 13 | 7.1% |
| %m/m | Oct 09 |
Based on Level | Level | ||||||||
| EMU | 4.1% | 2.5% | 6.3% | 86.2 | 41.1 | 222 | 117 | 65 | 53 | 100 | 11.6% |
| Germany | 3.9% | 1.7% | 6.3% | 90.8 | 38.0 | 201 | 121 | 72 | 49 | 100 | 19.9% |
| France | 3.4% | 5.9% | 2.3% | 91.1 | 40.9 | 187 | 119 | 72 | 47 | 100 | 25.5% |
| Italy | 4.4% | -1.5% | 4.5% | 90.0 | 42.7 | 214 | 121 | 67 | 54 | 100 | 14.7% |
| Spain | 2.4% | -1.5% | 3.7% | 82.6 | 31.9 | 220 | 117 | 67 | 50 | 99 | 12.4% |
| Memo: UK | 3.8% | 0.0% | 13.1% | 86.7 | 47.1 | 219 | 121 | 56 | 65 | 99 | 12.7% |
| Since Oct 1988 | 251 | -Count | Services: | 154 | -Count | ||||||
| Sentiment is an index, sector readings are net balance diffusion measures | |||||||||||
by Tom Moeller October 29, 2009
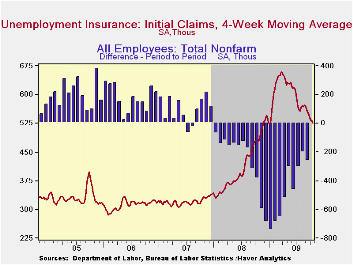 The trend
toward improvement in the job market continued this month. The Labor
Department indicated that initial claims for unemployment insurance
held roughly steady w/w at 530,000. The figures are down moderately
from an average of 549,000 claims during September and are down sharply
from the peak reached in March of 674,000 claims. The four-week moving
average of claims fell to 526,250 while the latest weekly figure was
slightly higher than Consensus expectations for 521,000 claims.
The trend
toward improvement in the job market continued this month. The Labor
Department indicated that initial claims for unemployment insurance
held roughly steady w/w at 530,000. The figures are down moderately
from an average of 549,000 claims during September and are down sharply
from the peak reached in March of 674,000 claims. The four-week moving
average of claims fell to 526,250 while the latest weekly figure was
slightly higher than Consensus expectations for 521,000 claims.
The largest increases in initial claims during the week ending October 17 were in California (+5,774, +12.6% y/y), Puerto Rico (+685, +52.9% y/y), Minnesota (+614, +38.8% y/y), Nevada (+366, 8.7% y/y ), and Nebraska (+239, -1.6% y/y), while the largest decreases were in Wisconsin (-5,681, +29.5%), New York (-4,711, +15.5% y/y), Pennsylvania (-4,033, +28.2% y/y), Illinois (-3,870, +44.9% y/y), and Oregon (-2,706, -16.6% y/y).
Continuing claims for unemployment insurance
during the latest week fell 148,000 to their lowest level since
late-March. 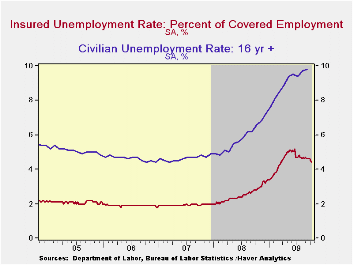 The decline reflects the improved job market but may also
be a function of the exhaustion of benefits. Continuing claims provide
an indication of workers' ability to find employment. The four-week
average of continuing claims fell modestly to 5,960,750 and have fallen
12.0% from their peak. This series dates back to
1966.
The decline reflects the improved job market but may also
be a function of the exhaustion of benefits. Continuing claims provide
an indication of workers' ability to find employment. The four-week
average of continuing claims fell modestly to 5,960,750 and have fallen
12.0% from their peak. This series dates back to
1966.
Extended benefits for unemployment insurance fell slightly for the first decline in seven weeks. The prior week's level was revised up. Through early-October extended benefits averaged 551,381.
The insured rate of unemployment slipped again to 4.4%, from an unrevised 4.5%, and matched its lowest since late-March. The rate reached a high of 5.2% during late-June. During the last ten years, there has been a 93% correlation between the level of the insured unemployment rate and the overall rate of unemployment published by the Bureau of Labor Statistics.
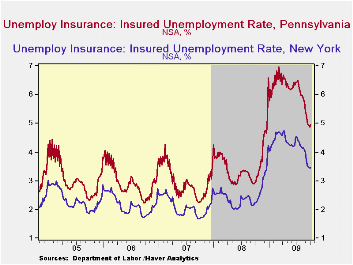 The lowest
insured unemployment
rates during the week ending October 9 were in North Dakota (1.1%),
South Dakota (1.1), Virginia (2.0), Wyoming (2.4), Maine (2.4), Texas
(2.6), Colorado (2.9), Minnesota (3.0), Maryland (3.1), Mississippi
(3.5), New York (3.5), Florida (3.7), and Georgia (3.8). The highest
insured unemployment rates were in Puerto Rico (6.3), Oregon (5.3),
Nevada (5.3), Pennsylvania (5.0), California (4.6), Michigan (4.6),
Wisconsin (4.8), North Carolina (4.5), South Carolina (4.5), and
Washington (4.3).
The lowest
insured unemployment
rates during the week ending October 9 were in North Dakota (1.1%),
South Dakota (1.1), Virginia (2.0), Wyoming (2.4), Maine (2.4), Texas
(2.6), Colorado (2.9), Minnesota (3.0), Maryland (3.1), Mississippi
(3.5), New York (3.5), Florida (3.7), and Georgia (3.8). The highest
insured unemployment rates were in Puerto Rico (6.3), Oregon (5.3),
Nevada (5.3), Pennsylvania (5.0), California (4.6), Michigan (4.6),
Wisconsin (4.8), North Carolina (4.5), South Carolina (4.5), and
Washington (4.3).
The unemployment insurance claims data is available in Haver's WEEKLY database and the state data is in the REGIONW database.
Birth date, business cycles, and lifetime income from the U.S. Office of Management and Budget is available here.
| Unemployment Insurance (000s) | 10/23/09 | 10/16/09 | 10/09/09 | Y/Y | 2008 | 2007 | 2006 |
|---|---|---|---|---|---|---|---|
| Initial Claims | 530 | 531 | 520 | 9.3% | 420 | 321 | 313 |
| Continuing Claims | -- | 5,797 | 5,945 | 53.6% | 3,342 | 2,552 | 2,459 |
| Insured Unemployment Rate (%) | -- | 4.4 | 4.5 | 2.8 (10/2008) | 2.5 | 1.9 | 1.9 |

Tom Moeller
AuthorMore in Author Profile »Prior to joining Haver Analytics in 2000, Mr. Moeller worked as the Economist at Chancellor Capital Management from 1985 to 1999. There, he developed comprehensive economic forecasts and interpreted economic data for equity and fixed income portfolio managers. Also at Chancellor, Mr. Moeller worked as an equity analyst and was responsible for researching and rating companies in the economically sensitive automobile and housing industries for investment in Chancellor’s equity portfolio. Prior to joining Chancellor, Mr. Moeller was an Economist at Citibank from 1979 to 1984. He also analyzed pricing behavior in the metals industry for the Council on Wage and Price Stability in Washington, D.C. In 1999, Mr. Moeller received the award for most accurate forecast from the Forecasters' Club of New York. From 1990 to 1992 he was President of the New York Association for Business Economists. Mr. Moeller earned an M.B.A. in Finance from Fordham University, where he graduated in 1987. He holds a Bachelor of Arts in Economics from George Washington University.
More Economy in Brief


