 Global| Oct 10 2003
Producer Prices Up Due To Food Price Surge
by:Tom Moeller
|in:Economy in Brief
Summary
Finished producer prices rose a surprising 0.3% in September. The gain was versus Consensus expectations for a 0.1% uptick. Core producer prices matched expectations for a 0.1% rise. A 1.2% (6.7% y/y) jump in food prices accounted for [...]
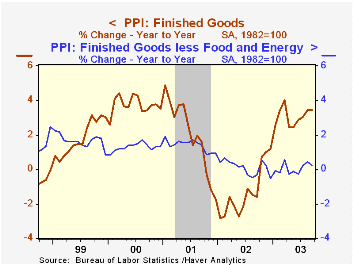
Finished producer prices rose a surprising 0.3% in September. The gain was versus Consensus expectations for a 0.1% uptick. Core producer prices matched expectations for a 0.1% rise.
A 1.2% (6.7% y/y) jump in food prices accounted for last month's PPI strength. Both vegetable and meat prices were quite strong and added to gains in earlier months.
Finished energy prices rose just 0.1% (13.1% y/y). The tepid increase was due to a 3.3% (21.7% y/y) rise in gasoline prices and a 1.2% (29.5%) gain in residential gas prices. These gains were offset by lower fuel oil prices, down 7.1% (-1.5% y/y). These energy product price series are NSA.
Core finished consumer goods prices were tame, rising 0.1% (-0.1% y/y) for the third consecutive month. Price declines were widespread. Capital equipment prices fell 0.1% (0.5% Y/Y) due to across the board weakness.
Intermediate goods prices fell 0.1% reflecting a 2.3% (12.7% y/y) decline in energy prices which offset a 2.3% (8.4%) jump in food prices. Core intermediate goods prices rose 0.1%. This measure of prices was unchanged from its March level.
Crude goods prices jumped 3.4% led by a 7.0% (17.9% y/y) surge in food prices. Crude energy prices were tame, up just 0.6% (32.9% y/y) following two months of decline. Core crude goods prices were strong for the second consecutive month and consistent with the recent strength in industrial commodity price series.
A report from the Federal Reserve Bank of New York analyzing the effect of exchange rates on import prices can be found here.
| Producer Price Index | Sept | Aug | Y/Y | 2002 | 2001 | 2000 |
|---|---|---|---|---|---|---|
| Finished Goods | 0.3% | 0.4% | 3.5% | -1.3% | 2.0% | 3.7% |
| Core | 0.0% | 0.1% | 0.2% | 0.1% | 1.4% | 1.3% |
| Intermediate Goods | -0.1% | 0.5% | 3.8% | -1.5% | 0.4% | 4.9% |
| Core | 0.1% | 0.1% | 1.7% | -0.5% | -0.1% | 2.6% |
| Crude Goods | 3.4% | -1.4% | 22.2% | -10.6% | 0.3% | 22.9% |
| Core | 2.3% | 3.7% | 11.0% | 3.8% | -10.0% | 7.4% |
by Tom Moeller October 10, 2003
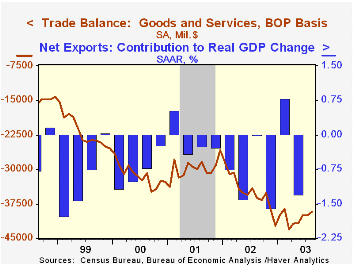
The U.S. foreign trade deficit narrowed unexpectedly to $39.2B in August versus Consensus expectations for a deficit of $41.0B.
In July and August the trade deficit narrowed to an average $39.6B versus $41.2B in 2Q. Nevertheless, for the first eight months of this years the trade deficit averaged a $486.6B annual rate.
Lower imports accounted for the narrower trade deficit in August. Declines were across the board but a 13.1% (-10.3% y/y) drop in the automotive category was notable. Nonpetroleum imports fell 3.4% (+0.3% y/y) and petroleum imports fell 5.3% (+5.3% y/y).
Exports fell 2.7% (4.9% YTD, AR) in August but earlier gains raised the level for 3Q 2.6% above 2Q. Exports of capital goods (9.9% YTD, AR) and nonauto consumer goods (10.3% YTD, AR) have moderated recently from earlier strength.
| Foreign Trade | Aug | July | Y/Y | 2002 | 2001 | 2000 |
|---|---|---|---|---|---|---|
| Trade Deficit | $39.2B | $40.0B | $36.2B(8/02) | $418.0B | $357.8B | $375.4B |
| Exports - Goods & Services | -2.7% | 1.8% | 1.4% | -3.3% | -5.8% | 11.8% |
| Imports - Goods & Services | -2.5% | 1.2% | 3.4% | 2.0% | -5.5% | 18.5% |

Tom Moeller
AuthorMore in Author Profile »Prior to joining Haver Analytics in 2000, Mr. Moeller worked as the Economist at Chancellor Capital Management from 1985 to 1999. There, he developed comprehensive economic forecasts and interpreted economic data for equity and fixed income portfolio managers. Also at Chancellor, Mr. Moeller worked as an equity analyst and was responsible for researching and rating companies in the economically sensitive automobile and housing industries for investment in Chancellor’s equity portfolio. Prior to joining Chancellor, Mr. Moeller was an Economist at Citibank from 1979 to 1984. He also analyzed pricing behavior in the metals industry for the Council on Wage and Price Stability in Washington, D.C. In 1999, Mr. Moeller received the award for most accurate forecast from the Forecasters' Club of New York. From 1990 to 1992 he was President of the New York Association for Business Economists. Mr. Moeller earned an M.B.A. in Finance from Fordham University, where he graduated in 1987. He holds a Bachelor of Arts in Economics from George Washington University.
More Economy in Brief


