 Global| Aug 14 2003
Producer Prices Up As Expected, But Core Prices Firmed
by:Tom Moeller
|in:Economy in Brief
Summary
Finished producer prices matched Consensus expectations and rose 0.2% in July following a 0.1% June drop. Excluding food and energy prices rose 0.2%, a bit more than expectations for no change. Higher prices for capital equipment led [...]
Finished producer prices matched Consensus expectations and rose 0.2% in July following a 0.1% June drop. Excluding food and energy prices rose 0.2%, a bit more than expectations for no change.
Higher prices for capital equipment led the advance in the core PPI. The gain reflected strong increases in the prices of civilian aircraft, office & store machines and transformers & power regulators.
Core finished consumer goods prices were tame, rising 0.1% (-0.1% y/y) following a 0.1% decline in June. Nondurables prices rose 0.1% (-0.2% y/y) and durables rose 0.2% (0.1% y/y).
Finished energy prices rose a modest 0.3% (14.6% y/y) following the strong 3.4% June gain. Gasoline prices rose 1.6% (16.2% y/y). Fuel oil prices rose 1.9% (18.9% y/y) and residential gas prices fell 0.8% (34.1% y/y). These energy product price series are NSA.
Intermediate goods prices rose 0.2% powered by a 1.3% gain in energy prices. A 44.6% (45.4% y/y) gain in residual fuel prices accounted for this strength. Core intermediate goods prices fell for the third month in the last four.
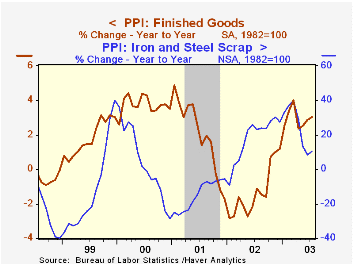
Crude goods prices dropped 2.9% as energy prices fell 4.4% (53.9% y/y). Crude petroleum prices were down but crude natural gas prices slid 6.2% pulling them down by almost a third versus the March peak. Core crude prices rose a moderate 0.8%. Iron and steel scrap prices (a very sensitive indicator of activity in the factory sector) rose 3.6% (10.8% y/y) for the first gain in four months.
| Producer Price Index | July | June | Y/Y | 2002 | 2001 | 2000 |
|---|---|---|---|---|---|---|
| Finished Goods | 0.1% | 0.5% | 3.0% | -1.3% | 2.0% | 3.7% |
| Core | 0.2% | -0.1% | 0.2% | 0.1% | 1.4% | 1.3% |
| Intermediate Goods | 0.2% | 0.5% | 4.4% | -1.5% | 0.4% | 4.9% |
| Core | -0.1% | 0.0% | 1.8% | -0.5% | -0.1% | 2.6% |
| Crude Goods | -2.9% | 4.5% | 24.7% | -10.6% | 0.3% | 22.8% |
| Core | 0.8% | 0.6% | 4.0% | 3.8% | -10.0% | 7.4% |
by Tom Moeller August 14, 2003
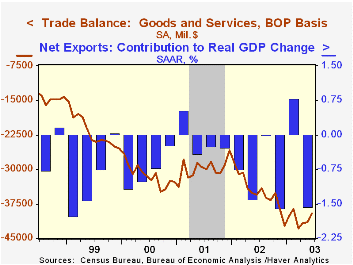
The U.S. foreign trade deficit narrowed unexpectedly to $39.5B in June versus Consensus expectations for a deficit of $41.6B. The deficit in May was revised slightly to $41.5B from $41.8B.
The narrower June trade deficit could lead to an upward revision of 2Q GDP growth.
For the first six months of this year, the trade deficit averaged a $488.6B annual rate.
Exports rose strongly for the second consecutive month, up 2.4%, and have risen at an 8.9% annual rate YTD. Exports of capital goods (15.4% YTD, AR) and nonauto consumer goods (20.6% YTD, AR) have been quite strong. Services exports surged 2.7% following a 3.4% gain in May.
Imports were unchanged in June reflecting a 4.4% m/m decline in imports of nonauto consumer goods that was offset by a gain in imports of autos and other goods. Petroleum imports rose 1.5% as the per barrel price of crude petroleum rose 5.8% to $25.50. The daily quantity of crude petroleum imports rose and is up 15.2% y/y.
The cover of the annual edition of International Economic Trends, titled "Border Effects", from the Federal Reserve Bank of St. Louis can be found here.
| Foreign Trade | June | May | Y/Y | 2002 | 2001 | 2000 |
|---|---|---|---|---|---|---|
| Trade Deficit | $39.5B | $41.5B | $35.6B(6/02) | $418.0B | $357.8B | $375.4B |
| Exports - Goods & Services | 2.4% | 1.7% | 3.2% | -3.3% | -5.8% | 11.8% |
| Imports - Goods & Services | 0.0% | 1.0% | 5.6% | 2.0% | -5.5% | 18.5% |
by Tom Moeller August 14, 2003
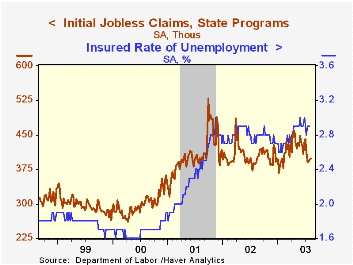
Initial claims for unemployment insurance rose a slight 2,000 to 398,000 and the prior week's level was revised up slightly. Consensus expectations had been for claims of 395,000.
The four-week moving average of initial claims fell to 394,250 (+2.6% y/y), the second consecutive and only the second week since late February below 400,000.
Continuing claims for unemployment insurance fell 6,000 (-0.2%) and the prior week's sharp increase was revised lower. It was the third decline in the last five weeks.
The insured rate of unemployment was stable at 2.9%.
| Unemployment Insurance (000s) | 8/09/03 | 8/02/03 | Y/Y | 2002 | 2001 | 2000 |
|---|---|---|---|---|---|---|
| Initial Claims | 398.0 | 396.0 | 2.3% | 404.3 | 406.0 | 299.7 |
| Continuing Claims | -- | 3,657 | 3.8% | 3,575 | 3,022 | 2,114 |

Tom Moeller
AuthorMore in Author Profile »Prior to joining Haver Analytics in 2000, Mr. Moeller worked as the Economist at Chancellor Capital Management from 1985 to 1999. There, he developed comprehensive economic forecasts and interpreted economic data for equity and fixed income portfolio managers. Also at Chancellor, Mr. Moeller worked as an equity analyst and was responsible for researching and rating companies in the economically sensitive automobile and housing industries for investment in Chancellor’s equity portfolio. Prior to joining Chancellor, Mr. Moeller was an Economist at Citibank from 1979 to 1984. He also analyzed pricing behavior in the metals industry for the Council on Wage and Price Stability in Washington, D.C. In 1999, Mr. Moeller received the award for most accurate forecast from the Forecasters' Club of New York. From 1990 to 1992 he was President of the New York Association for Business Economists. Mr. Moeller earned an M.B.A. in Finance from Fordham University, where he graduated in 1987. He holds a Bachelor of Arts in Economics from George Washington University.
More Economy in Brief


