 Global| Nov 16 2004
Producer Prices Surge, Core Strong
by:Tom Moeller
|in:Economy in Brief
Summary
The PPI for finished goods surged 1.7% last month, nearly triple Consensus expectations for a 0.6% gain and the strongest monthly increase since January 1990. Less food & energy, the 0.3% rise in "core" prices also was triple [...]
The PPI for finished goods surged 1.7% last month, nearly triple Consensus expectations for a 0.6% gain and the strongest monthly increase since January 1990. Less food & energy, the 0.3% rise in "core" prices also was triple expectations for a 0.1% gain.
Finished energy prices spiked 6.8% (17.0% y/y) higher paced by a 14.2% (45.3% y/y) rise in gasoline prices and an 18.7% (66.4% y/y) gain in fuel oil prices. Residential natural gas prices rose 1.7% (8.2% y/y).
A 0.2% gain in core finished consumer goods prices reflected a modest 0.2% (1.7% y/y) gain in nondurable goods prices but durables prices rose 0.4% (1.6% y/y) for the second consecutive month.Finished capital goods prices also rose 0.4% (1.9% y/y) for the second month.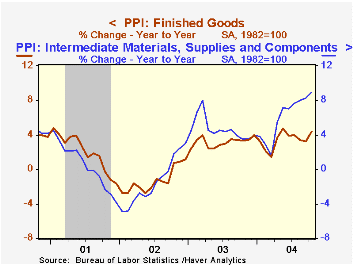
Finished food prices jumped 1.6% (2.4% y/y) reflecting strong gains in prices for fruits, vegetables and meats.
"Cattle prices on a two-year wild ride" from the Federal Reserve Bank of Minneapolis can be found here.
Crude prices reversed the prior month's decline with a 4.3% jump. Less food & energy, crude prices were more than firm with a 5.5% spike as metals prices took off; iron & steel scrap, +90.7% y/y; copper scrap, +47.2% y/y; nonferrous metal ores, +46.2% y/y. During the last thirty years "core" crude prices have been a fair indicator of industrial sector activity with a 51% correlation between the six month change in core crude prices and the change in factory sector industrial production.
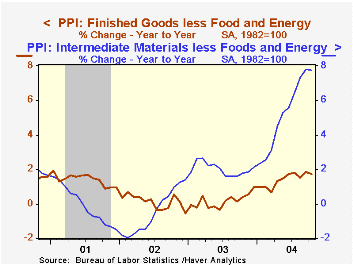
Intermediate goods prices jumped 0.9% higher as energy prices rose 4.3% (16.6% y/y). Core intermediate prices were tame and rose 0.3%.
| Producer Price Index | Oct | Sept | Y/Y | 2003 | 2002 | 2001 |
|---|---|---|---|---|---|---|
| Finished Goods | 1.7% | 0.1% | 4.4% | 3.2% | -1.3% | 2.0% |
| Core | 0.3% | 0.3% | 1.7% | 0.2% | 0.1% | 1.4% |
| Intermediate Goods | 0.9% | 0.1% | 8.9% | 4.7% | -1.5% | 0.4% |
| Core | 0.3% | 0.7% | 7.8% | 2.0% | -0.5% | -0.1% |
| Crude Goods | 4.3% | -4.2% | 15.8% | 25.1% | -10.6% | 0.3% |
| Core | 5.4% | -2.5% | 28.3% | 12.4% | 3.8% | -10.0% |

Tom Moeller
AuthorMore in Author Profile »Prior to joining Haver Analytics in 2000, Mr. Moeller worked as the Economist at Chancellor Capital Management from 1985 to 1999. There, he developed comprehensive economic forecasts and interpreted economic data for equity and fixed income portfolio managers. Also at Chancellor, Mr. Moeller worked as an equity analyst and was responsible for researching and rating companies in the economically sensitive automobile and housing industries for investment in Chancellor’s equity portfolio. Prior to joining Chancellor, Mr. Moeller was an Economist at Citibank from 1979 to 1984. He also analyzed pricing behavior in the metals industry for the Council on Wage and Price Stability in Washington, D.C. In 1999, Mr. Moeller received the award for most accurate forecast from the Forecasters' Club of New York. From 1990 to 1992 he was President of the New York Association for Business Economists. Mr. Moeller earned an M.B.A. in Finance from Fordham University, where he graduated in 1987. He holds a Bachelor of Arts in Economics from George Washington University.
More Economy in Brief


