 Global| Jun 13 2003
Producer Prices Fell Again
by:Tom Moeller
|in:Economy in Brief
Summary
Finished producer prices fell 0.3% in May following the record 1.9% April drop. Consensus expectations were for a 0.2% decline. Finished energy prices fell 2.6% and accounted for virtually all of the decline last month. Gasoline [...]
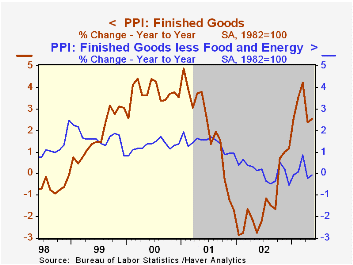
Finished producer prices fell 0.3% in May following the record 1.9% April drop. Consensus expectations were for a 0.2% decline.
Finished energy prices fell 2.6% and accounted for virtually all of the decline last month. Gasoline prices fell 6.0% (9.5% y/y). Fuel oil prices fell 11.4% (8.2% y/y). Residential gas prices rose 1.4% (31.5% y/y) following a 4.0% April drop. These energy product price series are NSA.
Excluding food and energy prices rose an expected 0.1%.
Core finished consumer goods prices rose 0.1% (-0.3% y/y) following the 1.3% April decline which largely reflected lower tobacco prices. Passenger car prices also fell 0.3% (-0.5% y/y). Prices for carpets, appliances and home electronic equipment fell but furniture prices rose slightly. Capital goods prices were unchanged (0.2% y/y) following the 0.5% April decline.
Intermediate goods prices dropped for the second month, down 0.8%. Energy prices fell 4.4% as natural gas prices to electric utilities fell 8.0% (39.6% y/y) following a 40.3% April drop. Commercial and industrial natural gas prices also fell, both for the second month.
Crude goods prices rose 1.7% recovering just some of the record 16.3% decline in April. Higher food and energy prices led the partial recovery even though crude petroleum prices fell. Crude natural gas prices rose 6.6% (71.6% y/y). Core crude prices again tumbled led down by lower metals prices. Iron & steel scrap prices fell 4.5%.
| Producer Price Index | May | April | Y/Y | 2002 | 2001 | 2000 |
|---|---|---|---|---|---|---|
| Finished Goods | -0.3% | -1.9% | 2.5% | -1.3% | 2.0% | 3.7% |
| Core | 0.1% | -0.9% | -0.1% | 0.1% | 1.4% | 1.3% |
| Intermediate Goods | -0.8% | -2.2% | 4.2% | -1.5% | 0.4% | 4.9% |
| Core | -0.1% | 0.0% | 2.3% | -0.5% | -0.1% | 2.6% |
| Crude Goods | 1.7% | -16.3% | 19.1% | -10.6% | 0.3% | 22.8% |
| Core | -1.9% | -1.3% | 7.2% | 3.8% | -10.0% | 7.4% |
by Tom Moeller June 13, 2003

The U.S. foreign trade deficit improved just slightly in April to $42.0B versus $42.9B in March. The April deficit was the third deepest on record. Consensus expectations for a deficit of $42.0B. March's deficit was little revised and revisions to prior years were small.
For the first four months of this year, the trade deficit averaged a $490.9B annual rate.
Imports fell 2.1% in April as the value of petroleum product imports fell 10.4%. The daily quantity of crude petroleum imports rose 8.1% but the average price fell 14.0% to $26.02.
Imports of nonauto consumer goods fell but still are up 11.0% y/y. Auto imports fell 2.3% (0.2% y/y). Capital goods imports rose 3.8% (1.6% y/y).
Exports fell a sharp 2.2% and March was revised to a slight decline.
Lower exports of nonauto consumer goods led the April decline, down 2.1% (0.8% y/y). Capital goods exports also sagged 2.6% (-4.7% y/y) for the second consecutive steep decline.
A report from the Federal Reserve Bank of St. Louis titled "World Trade: Past, Present, and Future" can be found here.
| Foreign Trade | April | Mar | Y/Y | 2002 | 2001 | 2000 |
|---|---|---|---|---|---|---|
| Trade Deficit | $42.0B | $42.9B | $34.2B(4/02) | $418.0B | $357.8B | $375.4B |
| Exports - Goods & Services | -2.2% | -0.1% | 0.4% | -3.3% | -5.8% | 11.8% |
| Imports - Goods & Services | -2.1% | 3.5% | 7.1% | 2.0% | -5.5% | 18.5% |
by Tom Moeller June 13, 2003

The mid-June reading of Consumer Sentiment from the University of Michigan fell 5.3% versus May to 87.2. Consensus expectations were for a reading of 93.5.
The index of consumer expectations fell 7.9% (-4.2% y/y) following sharp gains in the prior two months. The index of current conditions, down 1.3% m/m and off 7.5% y/y, fell for the fourth time this year.
Over the last ten years there has been a 64% correlation between the level of consumer sentiment and the y/y change in real PCE. The correlation over the last five years has been 82%.
The University of Michigan survey is not seasonally adjusted.It is based on telephone interviews with 250 households nationwide on personal finances and business and buying conditions. The survey is expanded to a total of 500 interviews at month end.
| University of Michigan | Mid-June | May | Y/Y | 2002 | 2001 | 2000 |
|---|---|---|---|---|---|---|
| Consumer Sentiment | 87.2 | 92.1 | -5.6% | 89.6 | 89.2 | 107.6 |

Tom Moeller
AuthorMore in Author Profile »Prior to joining Haver Analytics in 2000, Mr. Moeller worked as the Economist at Chancellor Capital Management from 1985 to 1999. There, he developed comprehensive economic forecasts and interpreted economic data for equity and fixed income portfolio managers. Also at Chancellor, Mr. Moeller worked as an equity analyst and was responsible for researching and rating companies in the economically sensitive automobile and housing industries for investment in Chancellor’s equity portfolio. Prior to joining Chancellor, Mr. Moeller was an Economist at Citibank from 1979 to 1984. He also analyzed pricing behavior in the metals industry for the Council on Wage and Price Stability in Washington, D.C. In 1999, Mr. Moeller received the award for most accurate forecast from the Forecasters' Club of New York. From 1990 to 1992 he was President of the New York Association for Business Economists. Mr. Moeller earned an M.B.A. in Finance from Fordham University, where he graduated in 1987. He holds a Bachelor of Arts in Economics from George Washington University.
More Economy in Brief


