 Global| Feb 17 2006
Producer Price Index Firm
by:Tom Moeller
|in:Economy in Brief
Summary
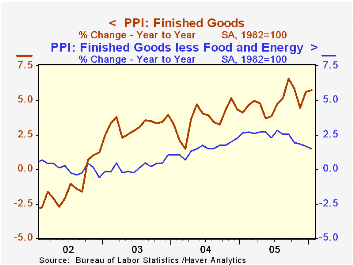
The 0.3% increase in the January Producer Price Index for Finished Goods again outpaced Consensus expectations which had been for a 0.2% rise, although the huge 0.9% rise previously reported for December was revised lower to 0.6%. [...]
The 0.3% increase in the January Producer Price Index for Finished Goods again outpaced Consensus expectations which had been for a 0.2% rise, although the huge 0.9% rise previously reported for December was revised lower to 0.6%.
Producer prices less food & energy also were (quite a bit) stronger than expectations for a 0.2% advance and rose 0.4%. The source of the upside surprise was concentrated in a 1.1% (-2.8% y/y) gain in passenger car prices and a 0.7% (-4.8% y/y) rise in light motor trucks. Civilian aircraft prices also rose a strong 0.7% (4.3% y/y).
Prices of all finished consumer goods less food & energy rose 0.4% (1.6% y/y) and core consumer nondurable goods prices gained 0.3% (2.8% y/y). Capital equipment prices increased 0.3% (1.4% y/y).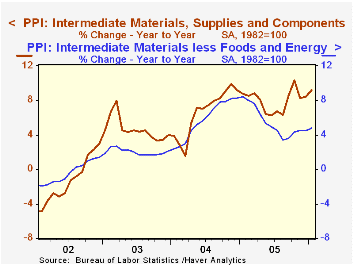
Finished energy prices were unchanged (25.1% y/y) in January as gasoline prices fell 3.5% (+40.5% y/y) and fuel oil prices fell 0.1% (+36.5% y/y). These declines were offset by residential electric power costs which rose 3.0% (9.2% y/y) and natural gas, up 0.8% (31.3% y/y).
Intermediate goods prices posted the strongest increase since October with a 1.2% gain led by a 1.0% rise in prices for core intermediate goods.
Crude goods prices fell for the third straight month. The 0.5% drop mostly reflected a 3.0% (-3.8% y/y) decline in food prices. Core crude prices slipped marginally after an upwardly revised 0.5% December increase. During the last thirty years "core" crude prices have been a fair indicator of industrial sector activity with a 48% correlation between the six month change in core crude prices and the change in factory sector industrial production.
| Producer Price Index | Jan | Dec | Y/Y | 2005 | 2004 | 2003 |
|---|---|---|---|---|---|---|
| Finished Goods | 0.3% | 0.6% | 5.7% | 4.9% | 3.6% | 3.2% |
| Core | 0.4% | 0.1% | 1.5% | 2.4% | 1.5% | 0.2% |
| Intermediate Goods | 1.2% | 0.1% | 9.2% | 8.0% | 6.6% | 4.6% |
| Core | 1.0% | 0.3% | 4.8% | 5.5% | 5.7% | 2.0% |
| Crude Goods | -0.5% | -2.3% | 22.4% | 14.6% | 17.5% | 25.1% |
| Core | -0.1% | 0.5% | 6.0% | 4.9% | 26.5% | 12.4% |
by Tom Moeller February 17, 2006
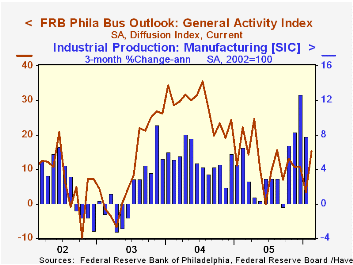
The Philadelphia Fed's February Index of General Business Conditions in the manufacturing sector more than reversed its recent weakness and jumped 12.1 points to 15.4, the highest level since last August. Consensus expectations had been for more moderate improvement to 9.1.
During the last ten years there has been a 68% correlation between the level of the Philadelphia Fed Business Conditions Index and three month growth in factory sector industrial production. There has been a 50% correlation with q/q growth in real GDP.
The sub index measuring unfilled orders improved markedly to the highest level since 20904. New orders also rose to 12.5, its highest since October and shipments surged to 22.5the highest level since last April. The index covering the number of employees slipped marginally to 11.3. During the last ten years there has been a 64% correlation between the employment index and the three month growth in factory payrolls.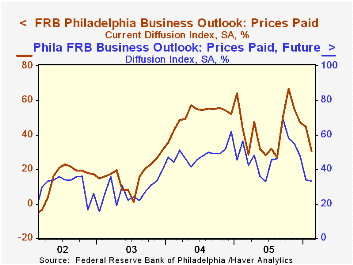
The business conditions index reflects a separate survey question, not the sub indexes, and most of the sub indexes improved this month versus December.
The separate index of expected business conditions in six months recovered about half of the prior month's decline. Expectations for employment also moved back into positive territory.
The prices paid index fell sharply as did the index of future prices. During the last ten years there has been a 75% correlation between the prices paid index and the three month growth in the intermediate goods PPI. The correlation with the finished goods PPI has been 50% and with the CPI it's been 43%.
The latest Business Outlook survey from the Philadelphia Federal Reserve Bank can be found here.
| Philadelphia Fed Business Outlook | Feb | Jan | Feb '05 | 2005 | 2004 | 2003 |
|---|---|---|---|---|---|---|
| General Activity Index | 15.4 | 3.3 | 22.1 | 12.4 | 28.0 | 10.5 |
| Prices Paid Index | 30.5 | 44.9 | 43.4 | 43.5 | 51.2 | 16.8 |
by Tom Moeller February 17, 2006
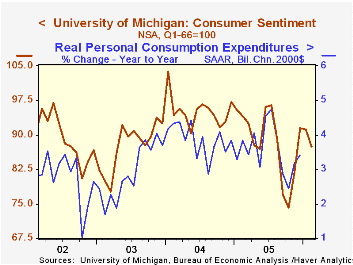
Consumer sentiment, according to the University of Michigan, fell this month. The preliminary sentiment index fell 4.2% m/m to 87.4 and compared to Consensus expectations for a roughly unchanged reading of 91.0.
During the last ten years there has been a 76% correlation between the level of consumer sentiment and the y/y change in real consumer spending.
Lower consumer expectations led the decline with a 5.7% drop following the 1.6% January fall. The long term economic outlook deteriorated sharply as the index of expected business conditions during the next five years fell 8.8% (-15.3% y/y). The one year outlook for business conditions suffered as well with the index down 6.7% (-14.0% y/y) and expectations for personal finances slipped another 1.7% (-7.1% y/y).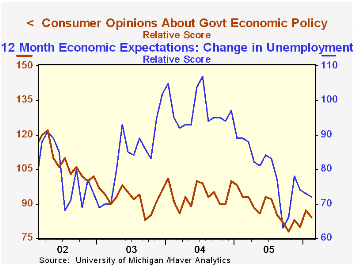
The mean expected inflation rate for the next twelve months was about stable m/m at 3.7%, still well below the 5.5% expected in October & September.
The current conditions index declined 2.4% as the reading of personal finances fell 2.5% (-5.0% y/y) and of buying conditions for large household goods fell 1.8%. Consumers' assessment of gov't economic policy slipped m/m (-9.7% y/y).
The University of Michigan survey is not seasonally adjusted.The mid-month survey is based on telephone interviews with 250 households nationwide on personal finances and business and buying conditions. The survey is expanded to a total of 500 interviews at month end.
| University of Michigan | Feb | Jan | Y/Y | 2005 | 2004 | 2003 |
|---|---|---|---|---|---|---|
| Consumer Sentiment | 87.4 | 91.2 | -7.1% | 88.6 | 95.2 | 87.6 |
| Current Conditions | 107.7 | 110.3 | -1.4% | 105.9 | 105.6 | 97.2 |
| Expectations | 74.4 | 78.9 | -11.8% | 77.4 | 88.5 | 81.4 |
by Carol Stone February 17, 2006
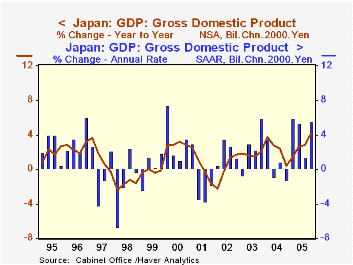
Japan's GDP grew at a 5.5% annual rate in Q4, making three strong quarters during 2005 and bringing the Q4/Q4 growth to 4.2%. Calculations of GDP have changed in recent years, so long history is not available on this same basis, but this Q4/Q4 advance is likely the strongest performance of the Japanese economy since about 1990. Moreover, the recent range of growth is similar to the magnitudes of the halcyon period of the late 1980s. [Note that "real GDP" is now defined in chain prices, but is available only since 1994. Fixed-weight GDP is available back to 1980, but Q4 on this basis will not be published until after the second release next month of the chained Q4 data. So exact information on these historical comparisons is not yet available.]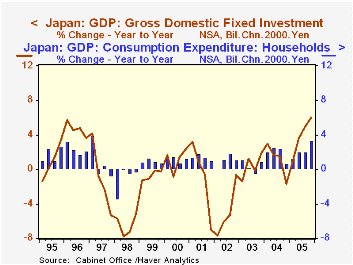
In Q4, household consumption grew at a 3.2% pace; this wasn't the highest of the year, but it brought the four-quarter growth to 3.3%, which was the highest since Q1 1997 (4.0%). The year 2005 as a whole saw 2.2% consumption growth, the largest since 1996. Similar comparisons apply to investment outlays (fixed capital formation): four-quarter growth of 6.0% is indeed the strongest since the current "official" GDP series begins in 1994, and the yearly total of 3.9% is the largest since 4.7% in 1996. [The good gains in 1996, it might be noted, were marked by substantial anticipatory buying ahead of an increase in Japan's consumption tax, so growth then was stimulated somewhat artificially, unlike the present, more fundamental progress.]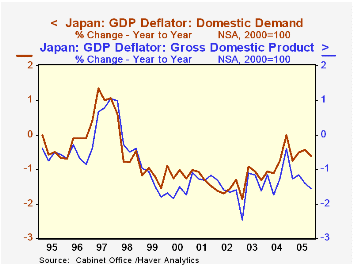
Net exports made a major contribution to Q4 GDP, with a continuing double-digit pace (annualized) for growth in exports, 13% in the quarter, the third consecutive such increase. Imports declined in chain-price terms, due to a substantial increase in import prices.
We have noted here several times recently that various price measures in Japan have started to stabilize following their long bout of deflation. The GDP deflator and other related price aggregates in the national accounts are still generally falling, though, as seen in the accompanying graph. However, in the latest quarter the role of that surge in import prices is evident as the total deflator is off 1.6% from a year earlier, but that for domestic demand (which nets out exports and imports) is down "only" 0.6%. But the increasing vigor of domestic demand suggests the possibility of reflation of the Japanese economy. In fact, investors picked this element to focus on in the wake of the better-than-expected growth report. Stock prices fell as investors evidently interpreted the good growth as a sign that the Bank of Japan's liquefying monetary policy might be shifted to a less accommodative stance.
| Japan (SAAR, %) | Q4 2005 | Q3 2005 | Q2 2005 | 2005 | 2004 | 2003 | 2002 |
|---|---|---|---|---|---|---|---|
| Total GDP | 5.5 | 1.4 | 5.4 | 2.8 | 2.3 | 1.8 | 0.1 |
| Household Consumption | 3.2 | 1.7 | 3.3 | 2.2 | 1.9 | 0.4 | 1.0 |
| Gross Domestic Fixed Capital Formation | 4.3 | 6.1 | 5.9 | 3.9 | 1.0 | 0.5 | -5.0 |
| Exports | 13.0 | 12.6 | 14.6 | 6.7 | 13.9 | 9.0 | 7.5 |
| Imports | -5.1 | 13.5 | 9.0 | 6.1 | 8.5 | 4.0 | 0.8 |
| Domestic Demand | 3.2 | 1.3 | 4.6 | 2.6 | 1.5 | 1.2 | -0.6 |

Tom Moeller
AuthorMore in Author Profile »Prior to joining Haver Analytics in 2000, Mr. Moeller worked as the Economist at Chancellor Capital Management from 1985 to 1999. There, he developed comprehensive economic forecasts and interpreted economic data for equity and fixed income portfolio managers. Also at Chancellor, Mr. Moeller worked as an equity analyst and was responsible for researching and rating companies in the economically sensitive automobile and housing industries for investment in Chancellor’s equity portfolio. Prior to joining Chancellor, Mr. Moeller was an Economist at Citibank from 1979 to 1984. He also analyzed pricing behavior in the metals industry for the Council on Wage and Price Stability in Washington, D.C. In 1999, Mr. Moeller received the award for most accurate forecast from the Forecasters' Club of New York. From 1990 to 1992 he was President of the New York Association for Business Economists. Mr. Moeller earned an M.B.A. in Finance from Fordham University, where he graduated in 1987. He holds a Bachelor of Arts in Economics from George Washington University.
More Economy in Brief


