 Global| Jan 17 2007
PPI Still Quite Firm in December
by:Tom Moeller
|in:Economy in Brief
Summary
The producer price index for finished goods gained another 0.9% last month after the 2.0% surge during November. Led by a 2.5% rise in energy prices and a 1.7% increase in food prices, the gain nearly doubled Consensus expectations [...]
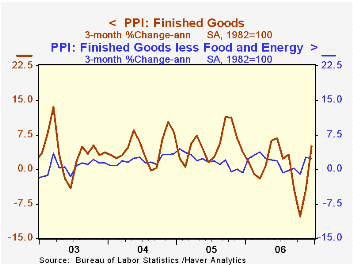
The producer price index for finished goods gained another 0.9% last month after the 2.0% surge during November. Led by a 2.5% rise in energy prices and a 1.7% increase in food prices, the gain nearly doubled Consensus expectations for a 0.5% rise.
The 0.2% core PPI rise calmed down after November's surprise 1.3% surge though that was double Consensus expectations for a 0.1% uptick.
The strength in finished energy goods prices was led by a 7.1% (1.8% y/y) surge in gasoline prices and a 4.0% (6.5% y/y) increase in fuel oil prices. Natural gas prices also increased 0.7% (-11.4% y/y).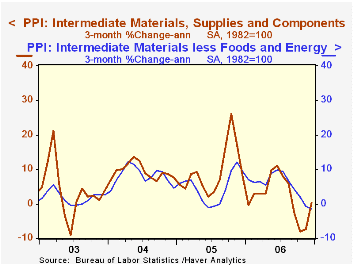
Finished consumer goods prices less food & energy rose 0.2% (2.0% y/y) after the 1.3% November surge. Passenger car prices fell 0.2% (-0.5% y/y) but furniture prices rose 0.1% (2.1% y/y).
Capital equipment prices increased 0.2% (2.3% y/y) as light truck prices rose 0.7% (2.2% y/y) after the 13.7% November spike.
Intermediate goods prices increased another 0.5% but prices less food & energy fell again with a 0.1% downtick which reflected another decline (-0.4%, +11.6% y/y) in steel mill product prices.
The crude materials PPI surged again by 2.9% led by a strength in crude petroleum prices which has since reversed. The core crude materials PPI also was firm led by a 12.4% rebound in iron & steel scrap prices (2.8% y/y).
| Producer Price Index | December | November | Y/Y | 2006 | 2005 | 2004 |
|---|---|---|---|---|---|---|
| Finished Goods | 0.9% | 2.0% | 1.2% | 2.9% | 4.9% | 3.6% |
| Core | 0.2% | 1.3% | 2.0% | 1.4% | 2.4% | 1.5% |
| Intermediate Goods | 0.5% | 0.7% | 2.8% | 6.5% | 8.0% | 6.6% |
| Core | -0.1% | -0.3% | 4.7% | 6.1% | 5.5% | 5.7% |
| Crude Goods | 2.9% | 15.7% | -2.4% | 1.8% | 14.6% | 17.5% |
| Core | 1.0% | 0.5% | 16.8% | 20.9% | 4.8% | 26.5% |
by Tom Moeller & Carol Stone January 17, 2007
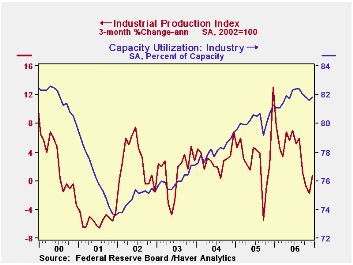
Total U.S. industrial production rose 0.4% last month but revisions generally had the effect of lowering the gains in output during the prior two months. Consensus expectations had been for a 0.1% December rise.
Factory sector output rose 0.7% but a November's 0.3% increase was revised to zero. Even so, the strong December brought manufacturing back to within a hairbreadth of its August high.
With a 1.5% (0.1% y/y) increase, production of durable consumer goods added to a slightly revised 1.6% gain in November, recovering further from its October plunge, which was revised lower still to a 2.3% fall. Both automotive products and home electronics had December increases of around 2%.
Nondurable consumer goods output slipped 0.2% (0.8% y/y) a second consecutive monthly decline. November was revised from a 0.1% decrease to -0.4%. Food and energy goods both fell, the former by 0.3% and the latter, 0.8%. Clothing had a nice rebound of 1.4% to partially offset.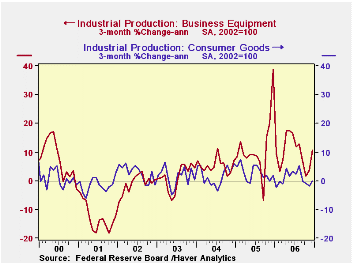
Business equipment production jumped 1.6% but both November and October were reduced, November to 0.9% from 1.2% reported before and October, registered a month ago at +0.2%, was trimmed to 0.1%. Output of all major types of equipment -- transit, information processing and industrial -- showed sizable December gains, but the downward revisions, which were the second in a row, leave us a bit cautious about characterizing the overall trend as a vigorous one.
Total industry capacity utilization increased to 81.8% in December from 81.6% in November. This latter period was, however, revised from an initial 81.8% reported last month. Factory sector utilization increased to 80.2% from downwardly revised 79.8% in November and 79.9% in October, both somewhat lower than reported a month ago. Factory sector capacity again rose 0.2%; November's 2.8% y/y gain represents a slight upward revision, but December's yearly increase in capacity eased to 2.7%.
| Production & Capacity | December | November | Y/Y | 2006 | 2005 | 2004 |
|---|---|---|---|---|---|---|
| Industrial Production | 0.4% | -0.1% | 3.0% | 4.1% | 3.2% | 2.5% |
| Manufacturing (NAICS) | 0.7% | 0.0% | 3.5% | 5.0% | 4.0% | 3.0% |
| Consumer Goods | 0.2% | 0.1% | 0.6% | 1.3% | 2.8% | 1.4% |
| Business Equipment | 1.6% | 0.9% | 10.4% | 11.7% | 7.9% | 4.3% |
| Capacity Utilization | 81.8% | 81.6% | 81.3% (12/05) | 81.8 | 80.2% | 78.1% |
by Carol Stone January 17, 2007
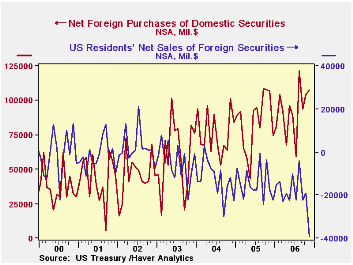
The US Treasury's monthly compilation of capital flows shows sizable foreign investment in US securities in November, amounting to $107.4 billion, purchases net of sales. This is modestly more than October's $104.2 billion and $107.0 billion in November 2005.
Press reports highlight another net figure, foreign investment in US securities less US residents' purchases of foreign securities. These were $39.1 billion in November, putting "net long term securities transactions" at $68.4 billion, down noticeably from October's $85.3 billion. Since, as we see, foreign purchases were nearly the same, the big difference in the month was the sharp increase in US investor purchases of foreign instruments, which had been $18.9 billion in October, less than half of the November amount. Even more interesting, the major part of that increase came in equities. US investors bought a significant $21.2 billion, $3.8 billion more than last November, which was the previous record amount. Net purchases of foreign bonds were $17.8 billion, which, while less than the equity purchases, was still the third largest month for that market segment.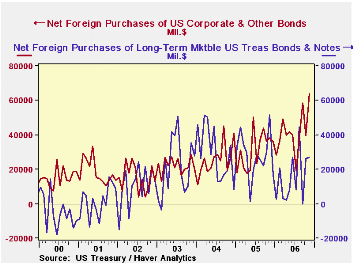
The foreign investments themselves took new paths. Usually months when Treasury refunding operations occur, as in November, contain outsized amounts of foreign purchases of that debt. This was moderately large, at $27 billion, but well down from the year-ago $51.8 billion.
The big difference this month was in corporate bonds. Foreign investors accumulated $63.9 billion in November. The previous record was $58.7 billion in September. The only other month above $50 billion is June 2005, at $50.5 billion. Investors in the UK seem to be the biggest net buyers, although the "clearinghouse" nature of the London markets means that the ultimate purchasers could be anywhere, not just in Britain.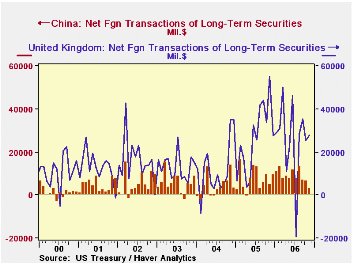
Speaking of countries, the ones show the biggest numbers this month are not who you think. While China has made sizable purchases all year long, they added only $3.1 billion in November, the smallest amount in 19 months. Japan has also not made outsized purchases lately, and some oil exporters [not much data on this sector is available] have actually been net sellers. The biggest gains recently have come from France and offshore Caribbean centers. UK investors have bought considerable volumes this year, but their purchases of US securities were much larger a year ago.
These variations and where they come from are another cautionary signal to us not to put much store in the notion that capital flows only serve to cover the trade deficit. If that were the case, the investments would match the trade partners and they would not likely be in equities or long-term bonds, but in trade financing vehicles, like loans. Global investors look for rate of return opportunities and those may be related to trade flows positively, negatively or not consistently at all.
| Net Foreign Purchases from US Residents, Bil $ | Nov 2006 | Oct 2006 | Nov 2005 | Monthly Averages||||
|---|---|---|---|---|---|---|---|
| Last 12 Months | 2005 | 2004 | 2003 | ||||
| 1. Domestic Securities | 107.4 | 104.2 | 107.0 | 92.4 | 84.3 | 76.4 | 60.0 |
| Treasuries | 27.1 | 26.3 | 51.8 | 15.5 | 28.2 | 29.3 | 22.0 |
| Agencies | 14.7 | 15.2 | 11.1 | 22.2 | 18.3 | 18.9 | 13.0 |
| Corporate Bonds | 63.9 | 39.5 | 38.3 | 40.8 | 31.0 | 25.8 | 22.1 |
| Equities | 1.8 | 23.2 | 5.7 | 12.3 | 6.8 | 2.4 | 2.9 |
| 2. Foreign Securities | -39.1 | -18.9 | -17.7 | -19.3 | -14.4 | -12.7 | -4.7 |
| 3. "Other Acquisition"* | -10.4 | -10.4 | -11.1 | -11.8 | -11.7 | -3.2 | -11.6 |
| 4. Net Foreign Acquisition (1+2+3) | 58.0 | 74.9 | 78.1 | 59.7 | 58.3 | 60.4 | 43.7 |
| 5. Short-Term Liabilities | 15.6 | 0.5 | 2.5 | 9.4 | -4.0 | 15.8 | 1.3 |
| 6. Total TIC Flows** | 74.9 | 60.4 | 88.5 | 70.3 | 55.7 | 81.6 | 59.8 |

Tom Moeller
AuthorMore in Author Profile »Prior to joining Haver Analytics in 2000, Mr. Moeller worked as the Economist at Chancellor Capital Management from 1985 to 1999. There, he developed comprehensive economic forecasts and interpreted economic data for equity and fixed income portfolio managers. Also at Chancellor, Mr. Moeller worked as an equity analyst and was responsible for researching and rating companies in the economically sensitive automobile and housing industries for investment in Chancellor’s equity portfolio. Prior to joining Chancellor, Mr. Moeller was an Economist at Citibank from 1979 to 1984. He also analyzed pricing behavior in the metals industry for the Council on Wage and Price Stability in Washington, D.C. In 1999, Mr. Moeller received the award for most accurate forecast from the Forecasters' Club of New York. From 1990 to 1992 he was President of the New York Association for Business Economists. Mr. Moeller earned an M.B.A. in Finance from Fordham University, where he graduated in 1987. He holds a Bachelor of Arts in Economics from George Washington University.
More Economy in Brief


