 Global| Dec 20 2005
PPI Down 0.7%, Core Tame
by:Tom Moeller
|in:Economy in Brief
Summary
The November Producer Price Index reversed the prior month's gain and fell 0.7%. The decline was the largest for any month since April 2003 andslightly exceeded Consensus expectations for a 0.5% drop. In a reverse of the prior month's [...]
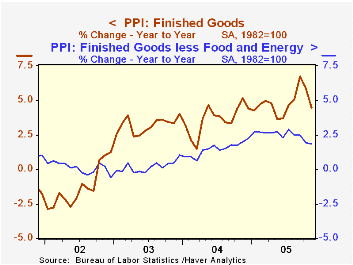
The November Producer Price Index reversed the prior month's gain and fell 0.7%. The decline was the largest for any month since April 2003 andslightly exceeded Consensus expectations for a 0.5% drop.
In a reverse of the prior month's strength, home heating oil prices fell 15.5% (+30.5% y/y) and natural gas prices declined 0.5% (+31.0% y/y), both seasonally adjusted. Gasoline prices added to the prior month's drop with a 10.7% (+19.4% y/y) decline.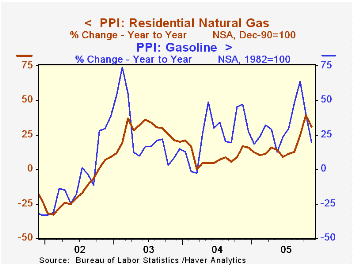
"Core" producer prices edged up 0.1% following the prior month's 0.3% decline and the rise fell short of Consensus expectations for a 0.2% increase.
Prices of finished consumer goods less food & energy rose 0.2% (2.0% y/y) and the gain was driven by a 0.5% (3.7% y/y) surge in core consumer nondurable goods prices. Durable goods prices fell another 0.2% -0.2% y/y) on top of the 0.9% October decline led by passenger car prices which fell 0.8% (-3.2% y/y). Capital equipment prices fell for the third month in the last four led by a 0.8% (-4.1% y/y) decline in truck prices.
Intermediate goods prices reversed only some of the prior month's strength with a 1.2% decline. Core intermediate goods prices remained firm and rose 0.5% on top of two months of 1.2% gain.
Crude energy prices similarly remained firm. The 1.2% decline in the total only dented the strong gains during four months because core crude prices soared 5.4% led by an 18.8% (-14.4% y/y) surge in iron & steel scrap prices. During the last thirty years "core" crude prices have been a fair indicator of industrial sector activity with a 48% correlation between the six month change in core crude prices and the change in factory sector industrial production.
Inflation Targeting under Commitment and Discretion from the Federal Reserve Bank of San Francisco can be found here.
| Producer Price Index | Nov | Oct | Y/Y | 2004 | 2003 | 2002 |
|---|---|---|---|---|---|---|
| Finished Goods | -0.7% | 0.7% | 4.5% | 3.6% | 3.2% | -1.3% |
| Core | 0.1% | -0.3% | 1.8% | 1.5% | 0.2% | 0.1% |
| Intermediate Goods | -1.2% | 3.0% | 8.4% | 6.6% | 4.6% | -1.5% |
| Core | 0.5% | 1.2% | 4.5% | 5.7% | 2.0% | -0.5% |
| Crude Goods | -1.2% | 6.7% | 20.8% | 17.5% | 25.1% | -10.6% |
| Core | 5.4% | -1.2% | 3.1% | 26.6% | 12.4% | 3.8% |
by Tom Moeller December 20, 2005
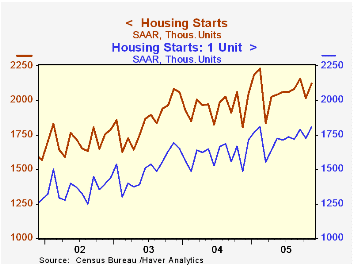
Housing starts surged 5.3% m/m in November. The gain to 2.123M units reversed most of the prior month's decline and beat Consensus expectations for a decline to 2.015M starts.
A 4.8% gain in single-family starts returned the level to its record height of 1.808M achieved this past February. The gain was most pronounced in the West where starts rose 14.4% (25.8% y/y) and in the Midwest where starts rose 7.5% (22.5% y/y). In the South single family starts rose just 0.8% (22.1% y/y) but in the Northeast single family starts fell for the fourth month in the last five (+5.8% y/y).
Multi family starts recovered about one third of the prior month's skid with a 7.9% m/m gain and building permits recovered about half of the prior month's 5.2% drop as single family permits inched up just 0.2% (7.7% y/y).
| Housing Starts (000s, AR) | Nov | Oct | Y/Y | 2004 | 2003 | 2002 |
|---|---|---|---|---|---|---|
| Total | 2,123 | 2,017 | 17.5% | 1,950 | 1,854 | 1,7 10 |
| Single-family | 1,808 | 1,725 | 21.8% | 1,604 | 1,505 | 1,363 |
| Multi-family | 315 | 292 | -2.5% | 345 | 349 | 347 |
| Building Permits | 2,155 | 2,103 | 3.0% | 2,058 | 1,8 88 | 1,749 |
by Tom Moeller December 20, 2005
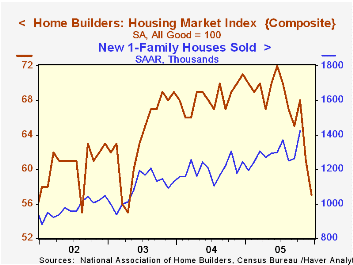
The National Association of Home Builders' (NAHB) Composite Housing Market Index fell again in December; by four points on top of a seven point November decline. The decline to 57 dropped the index to the lowest level since April 2003 and the index ended the year roughly 20% below the year end 2004 level.
During the last twenty years the y/y change in the annual composite index has had an 85% correlation with the change in single family housing starts and there has been a 75% correlation between the current sales index and new single family home sales.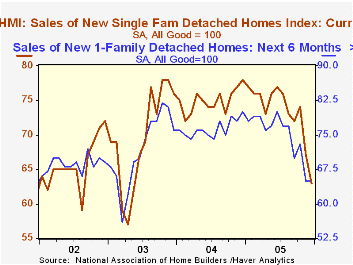
The m/m drop reflected sharp declines throughout the country, notably in the West.
The index for current sales of single family homes in December fell sharply to the lowest level since May 2003 while the index for sales in six months also fell hard the lowest in over two years.
Traffic of prospective home buyers plunged to its lowest level since the Spring of 2003.
The NAHB index is a diffusion index based on a survey of builders. Readings above 50 signal that more builders view conditions as good than poor.
Visit the National Association of Home Builders.
| Nat'l Association of Home Builders | Dec | Nov | Dec '04 | 2005 | 2004 | 2003 |
|---|---|---|---|---|---|---|
| Composite Housing Market Index | 57 | 61 | 71 | 67 | 68 | 64 |
by Tom Moeller December 20, 2005
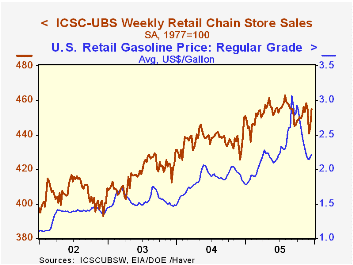
Chain store sales rose 2.4% last week. The jump followed a 0.9% gain the prior period and thus recovered all of December's opening week skid of 3.1%, according to the International Council of Shopping Centers (ICSC)-UBS survey. Nevertheless, sales so far in December remained 2.0% below the November average which rose 1.2% from October.
During the last ten years there has been a 51% correlation between the y/y change in chain store sales and the change in non-auto retail sales less gasoline, as published by the US Census Department. Chain store sales correspond directly with roughly 14% of non-auto retail sales less gasoline. The leading indicator of chain store sales from ICSC slipped 0.4% (-1.6% y/y) following two weeks of gain. The gains in store sales may be limited by the drain on consumers' budgets from higher gasoline prices, which rose to $2.21 per gallon (21.8% y/y) last week. Some relief may, however, be forthcoming if the last two days' decline in the spot market price for unleaded gasoline hold.The ICSC-UBS retail chain-store sales index is constructed using the same-store sales (stores open for one year) reported by 78 stores of seven retailers: Dayton Hudson, Federated, Kmart, May, J.C. Penney, Sears and Wal-Mart.
| ICSC-UBS (SA, 1977=100) | 12/17/05 | 12/10/05 | Y/Y | 2004 | 2003 |
|---|---|---|---|---|---|
| Total Weekly Chain Store Sales | 455.0 | 444.5 | 3.9% | 4.6% | 2.9% |
by Louise Curley December 20, 2005
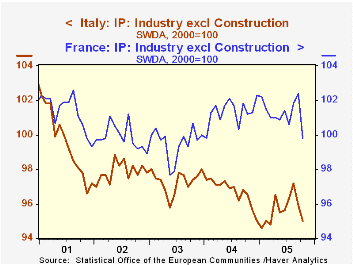
Industrial production in France, Germany and Italy, the three largest countries in the Euro Zone, shows distinctly different trends. While German industrial production has recently shown strength, Italian production has trended downward and French production has shown little trend. In Germany, industrial production increased 1.1% in October from September and was 4.2% above October, 2004. The comparable figures for France were -2.5% and 1.4%; and, for Italy, -0.9% and -1.6%.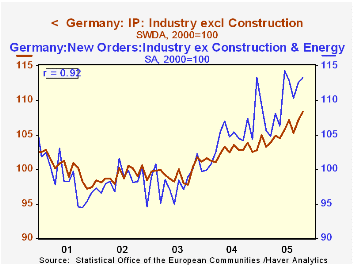 The sharp drop in French production in October may have been affected by the racial unrest that took place during that time, nevertheless, the trend of production in France has been relatively flat since early 2004. Industrial production in Italy, on the other hand, has been in a declining trend over most of the last five years. Industrial production in France and Italy are shown in the first chart. (The data on industrial production are from Eurostat which insures comparability of data among countries by harmonizing the concepts used by individual countries of the Euro Zone.)
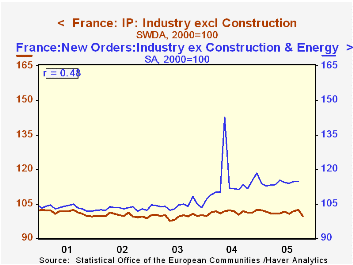
Eurostat data on new orders will not be published until Thursday of this week, but Germany, France and Italy have released their national data on new orders today. In contrast to the trends in industrial production, the trends in new orders in all three countries have generally been rising since mid 2003. German new orders increased by 2.4% in October from September and were almost 10% above October 2004. While the October figures for France and Italy showed declines from September of respectively -2.1% and -1.1%, they were 2.6% and 2.2% respectively above October 2004.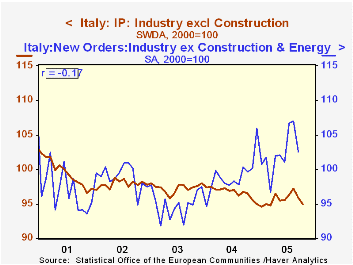
It is not possible to generalize on the relationship between new orders and industrial production on the basis of the experience of these three countries. In the three charts showing new orders and industrial production for each country, the correlations between the two series vary from -0.17 for Italy, 0.47 for France and 0.92 for Germany.
| Oct 05 | Sep 05 | Oct 04 | M/M % | Y/Y % | 2004 | 2003 | 2002 | |
|---|---|---|---|---|---|---|---|---|
| Industrial Production ex Construction ( 2000=100) | ||||||||
| France | 99.8 | 102.4 | 101.2 | -2.54 | -1.38 | 101.3 | 99.5 | 99.9 |
| Italy | 95.0 | 95.9 | 96.5 | -0.94 | -1.55 | 96.7 | 97.3 | 97.9 |
| Germany | 108.3 | 107.1 | 103.9 | 1.12 | 4.23 | 102.5 | 99.5 | 99.1 |
| Total Euro Zone | 102.8 | 103.6 | 102.6 | -0.81 | 0.20 | 102.1 | 100.2 | 99.9 |
| New Orders (2000=100) | ||||||||
| France | 107.4 | 109.7 | 104.7 | -2.10 | 2.58 | 111.6 | 100.7 | 99.3 |
| Italy | 102.0 | 103.1 | 99.8 | -1.07 | 2.20 | 99.0 | 95.5 | 99.1 |
| Germany | 116.6 | 113.9 | 106.1 | 2.37 | 9.90 | 104.8 . | 99.0 | 98.3 |

Tom Moeller
AuthorMore in Author Profile »Prior to joining Haver Analytics in 2000, Mr. Moeller worked as the Economist at Chancellor Capital Management from 1985 to 1999. There, he developed comprehensive economic forecasts and interpreted economic data for equity and fixed income portfolio managers. Also at Chancellor, Mr. Moeller worked as an equity analyst and was responsible for researching and rating companies in the economically sensitive automobile and housing industries for investment in Chancellor’s equity portfolio. Prior to joining Chancellor, Mr. Moeller was an Economist at Citibank from 1979 to 1984. He also analyzed pricing behavior in the metals industry for the Council on Wage and Price Stability in Washington, D.C. In 1999, Mr. Moeller received the award for most accurate forecast from the Forecasters' Club of New York. From 1990 to 1992 he was President of the New York Association for Business Economists. Mr. Moeller earned an M.B.A. in Finance from Fordham University, where he graduated in 1987. He holds a Bachelor of Arts in Economics from George Washington University.
More Economy in Brief


