 Global| May 17 2007
Philly Index Points Way Higher
Summary
Pictured on the left is the Philadelphia barometer for its OUTLOOK index that looks 6-months ahead. The index has made a considerable rebound and is now closer to giving off a signal of normal growth for the future based on the [...]
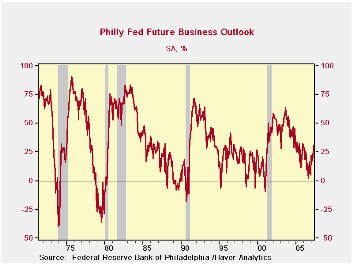
Pictured on the left is the Philadelphia barometer for its OUTLOOK index that looks 6-months ahead. The index has made a considerable rebound and is now closer to giving off a signal of normal growth for the future based on the position of this index in its range of values going back to 1968.
Few plot this index but I like it because it has been such a good and consistent harbinger of recessions and weakness and then of recovery (see chart). The index turned negative and before each recession since 1974. If you view a below zero reading as a signal for recession, it has given off some false ones, but it does give off weak signals when MFG is weak and its reports tend to be early-to-timely. Its ‘false’ signals have tended to be more isolated or single weak readings. However, ahead of the 2001 recession this index did not give off a powerful series of negative readings it just gave off a few. But then it did emit strong signals of coming recovery – and that was even though the recovery itself proved to be tepid. .
The signal for this index that is unimpeachable is that once it has been weak and rebounds it signals growth The only thing close to an exception to this result was that the cluster of recession-indicating weaker readings ahead of the 1991 recession was followed by a series of positive readings (none as strong as +20, however) before the recession actually occurred. The index had signaled recession ahead. But then there was a weak rise (weaker than what the barometer is signaling right now) and then recession kicked in. Once the recession started the outlook barometer dipped again, then moved up strongly near the end of recession to signal oncoming recovery.
Against that background the recovery signals from the Philly outlook are now impressively stronger and are coming off a set of weak readings that did not turn the barometer negative at any point. It may not be safe to assume anything but this index is something to encourage you to become more optimistic. It is signaling continued growth.
Its upbeat signal joins with the sharp March rise in industrial output and the recovery in the Empire State index for May. Jobless claims fell further below the 300k level this week in another upbeat sign. Economic signals remain mixed to be sure but a series of reports from this week (and I’ll throw in the tentative sign of bottoming from housing starts) are reason to be more optimistic.
The table below grinds out relationships for the more conventionally watched Philadelphia current index. The various readings confirm that the current index is still quite weak but it has moved up with the key orders and shipments series as two of the best-advancing components. Employment has advanced sharply even if it has been at the cost of the length of the work week. Substituting full time workers for longer hours is usually a good sign for the economy.
| Index:C | New Ord:C | Shipmnt:C | Deliv. | Inventory | Backlog | Pr:Pd | Pr:Rcd | Employ:C | Wrk Hrs | |
| May-07 | 4.2 | 8.7 | 9.3 | -8.2 | -6.9 | -9.1 | 32.3 | 2.2 | 12.9 | -5.5 |
| Apr-07 | 0.2 | 2.8 | 4.3 | -11.9 | -3.1 | -13.7 | 24.3 | 5.2 | 2.5 | 5.5 |
| Mar-07 | 0.2 | 1.9 | 6.8 | -13.2 | -3.7 | -20.9 | 21.8 | 16.3 | 2.3 | -4.9 |
| Average | 9.7 | 10.6 | 14.7 | -3.4 | -6.8 | -5.8 | 29.8 | 11.3 | -0.1 | -1.1 |
| Median | 11.5 | 13.3 | 15.9 | -2.5 | -6.8 | -4.3 | 26.7 | 8.9 | 2.1 | 0.0 |
| max | 58.9 | 56.2 | 48.3 | 19.9 | 27.6 | 44.6 | 91.0 | 63.8 | 24.4 | 22.7 |
| Min | -57.9 | -53.5 | -32.2 | -33.6 | -50.7 | -60.9 | -16.4 | -18.2 | -40.0 | -45.6 |
| % of Range reading | ||||||||||
| Current | 53.2% | 56.7% | 51.6% | 47.5% | 55.9% | 49.1% | 45.3% | 24.9% | 82.1% | 58.7% |
| Future | 43.4% | 56.7% | 56.7% | 51.7% | 39.2% | 41.5% | 36.4% | 34.7% | 54.5% | 52.7% |

Robert Brusca
AuthorMore in Author Profile »Robert A. Brusca is Chief Economist of Fact and Opinion Economics, a consulting firm he founded in Manhattan. He has been an economist on Wall Street for over 25 years. He has visited central banking and large institutional clients in over 30 countries in his career as an economist. Mr. Brusca was a Divisional Research Chief at the Federal Reserve Bank of NY (Chief of the International Financial markets Division), a Fed Watcher at Irving Trust and Chief Economist at Nikko Securities International. He is widely quoted and appears in various media. Mr. Brusca holds an MA and Ph.D. in economics from Michigan State University and a BA in Economics from the University of Michigan. His research pursues his strong interests in non aligned policy economics as well as international economics. FAO Economics’ research targets investors to assist them in making better investment decisions in stocks, bonds and in a variety of international assets. The company does not manage money and has no conflicts in giving economic advice.
More Economy in Brief


