 Global| Jul 18 2008
Philadelphia Fed Index Stable & Low, Prices Surged
by:Tom Moeller
|in:Economy in Brief
Summary
The Philadelphia Federal Reserve Bank indicated that its July Index of General Business conditions in the manufacturing sector held roughly stable at -16.3. The prior month's index reading was a low -17.1 and a level of -15 had been [...]
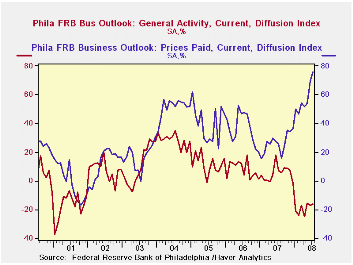
The Philadelphia Federal Reserve Bank indicated that its July Index of General Business conditions in the manufacturing sector held roughly stable at -16.3. The prior month's index reading was a low -17.1 and a level of -15 had been expected for this month.
The Philadelphia Fed constructs a diffusion index for total business activity and each of the sub indexes. The business conditions index reflects a separate survey question, not the sub-indexes.
During the last ten years there has been a 61% correlation
between the level of the Philadelphia Fed Business Conditions Index and
the three-month growth in factory sector industrial production. There
has been a 43% correlation with q/q growth in real GDP.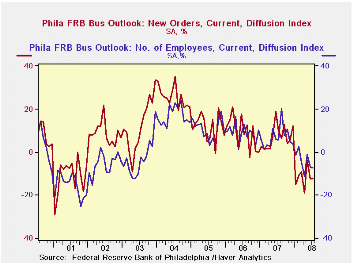
The new orders sub-index held at its June level. The reading of -12.1 was still, however, up off the absolute low of -18.8 in April. The shipments index showed the same pattern at -8.0.
The employment index, at -7.3, recently showed the same pattern as orders and shipments.Though a somewhat improved 16.9% of respondents expected to increase employment levels, 24.2% expected to decrease them.
The prices paid index again surged, to the highest level since early-1980. During the last ten years there has been a 67% correlation between the prices paid index and the three-month growth in the intermediate goods PPI. There has been an 82% correlation with the change in core intermediate goods prices.
The separate index of expected business conditions in six months fell for the second month, to 18.0. The recent levels of index were well below the full-year, 2007 reading of 24.7. Expectations for unfilled orders and delivery times fell sharply while new orders were unchanged and employment rose. The prices slipped after the June surge.
The latest Business Outlook Survey from the Federal Reserve Bank of Philadelphia can be found here.
The Changing Nature of the U.S. Balance of Payments from the Federal Reserve Bank of New York can be found here.
| Philadelphia Fed (%) | July | June | July '07 | 2007 | 2006 | 2005 |
|---|---|---|---|---|---|---|
| General Activity Index | -16.3 | -17.1 | 16.9 | 5.1 | 8.1 | 11.5 |
| Prices Paid Index | 75.6 | 69.3 | 25.8 | 26.4 | 36.6 | 40.1 |
by Tom Moeller July 18, 2008
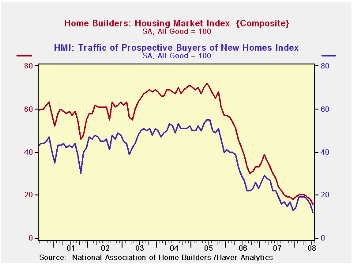
The National Association of Home Builders' (NAHB) reported that its July Composite Housing Market Index fell to 16 from 18 in June. The latest level was the lowest in the series' history which extends back to 1984 and it was more than two-thirds lower than the high during 2004.
During the last twenty years there has been a 76% correlation
between the y/y change in the Composite Index and the change in single
family housing starts.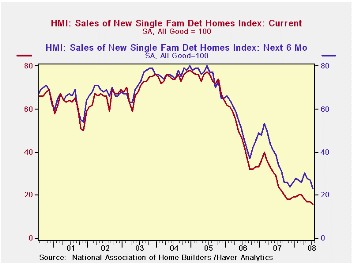
The index for single-family detached homes also fell to a new series' low while builders' view of single-family home sales during the next six months fell to the series' low.
Except for a modest uptick in the Northeast, the builders' index in the country's regions continued to decline.
Traffic of prospective home buyers declined and hit a new low for the series.
The NAHB index is a diffusion index based on a survey of builders. Readings above 50 signal that more builders view conditions good than poor.
Visit the National Association of Home Builders.
The Mortgage Crisis: Let Markets Work, But Compensate the Truly Needy from the Federal Reserve Bank of St. Louis is available here.
| Nat'l Association of Home Builders | July | June | July '07 | 2007 | 2006 | 2005 |
|---|---|---|---|---|---|---|
| Composite Housing Market Index | 16 | 18 | 24 | 27 | 42 | 67 |
by Robert Brusca July 18, 2008
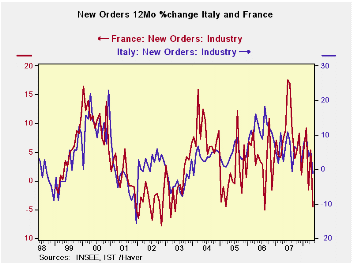
WEAKNESS!! French and Italian industrial orders fell sharply in May joining the chorus of Euro signals that are screaming ‘weakness!’ For each country both domestic and foreign orders fell sharply. Each country had posted an increase in domestic orders in April. Yet in May Yr/Yr orders are off and France’s orders are off very sharply. Both have foreign orders off sharply Yr/Yr.
Square one? One thing that seems clear is that the setback to growth is just beginning. Yet, ECB President Trichet says that EMU could hit its low in Q2 or Q3 then begin a moderate recovery. This is a very upbeat view of the economic circumstances given that it is July and the data for May and June are just beginning to show significant setbacks while more topical outlook surveys have been faltering for some time.
Boom/Bust - The average of French and Italian foreign orders growth is the weakest since May of 2003. The falloff is from a 20% Yr/Yr increase in June of 2007 to a Yr/Yr decline in foreign orders of 6.1%, just 11 months later. This is a clear boom/bust scenario for foreign orders in these two key EMU nations. The risk in such a sharp turnaround is that problems can develop and spread since firms usually cannot predict and be prepared for such a sharp change in trend. Both Italy and France are affected by a sharp deceleration in order growth.
Undue optimism? On balance, the risk to e-Zone growth seems highly likely to extend past Q2 and probably past Q3 as well. Italy and France are likely very representative of the condition other EMU nations. Trichet seems to be promoting a ‘best case’ scenario of sorts even as growth in the world economy is just coming into the grip of a decelerating phase. Monetary policies have not shifted to accommodation so the expectation of a bottom seems premature and without foundation especially for the e-zone where the last policy act was a rate HIKE and where the currency is still moving higher.
Monetary stimulus: lacking or ineffective - Only in the US where the Fed cut official rates has there been an attempt at stimulative central bank action of any degree. But the Fed’s policy shift has been ‘undone’ by private sector credit policy decisions that have result in higher market rates as official rates were cut. The attempt at stimulus seems to have been blunted. In its recent outlook the IMF hiked various world regional growth estimates based on water under the bridge (experienced Q1;Q2 growth), but registered increased- not diminished – concerns for the period ahead – especially for the individual quarters of the second half.
Fiscal stimulus, ditto - On balance, it is hard to see what creates the quick turnaround that Trichet foresees and the IMF does not. Only in the US has there been a stimulative fiscal policy response, although the UK seems to be considering rule changes that might give it some flexibility to act on that front as well. For the most part the slide to weaker growth seems to be in its infancy not in a mature stage that is about to run its course. To the grief of China the weakness could come in its most intense form just as the Olympics are getting not gear.
Decoupling view decouples from reality - All views of de-coupling from the US down-cycle have been cast aside. Wall Street strategists that recommended a de-coupling investment strategy have rescinded their support of it. That should be enough to underline how much the private sector disagrees with the view held by Mr Trichet. Not only will Europe not evade the encroaching slowdown or snap out of it quickly, but there is increasing concern about the impact of the slowdown on the fast growing ‘developing world’.
| Italy Orders | ||||||
|---|---|---|---|---|---|---|
| Saar exept m/m | MAY-08 | APR-08 | MAR-08 | 3-mo | 6-mo | 12-mo |
| Total | -3.1% | 0.5% | -0.9% | -13.4% | -8.2% | -1.1% |
| Foreign | -2.0% | -1.6% | -0.8% | -16.6% | -12.6% | -3.4% |
| Domestic | -3.6% | 1.6% | -0.9% | -11.4% | -5.7% | 0.2% |
| Memo | ||||||
| Sales | -1.7% | 2.2% | -1.6% | -4.3% | 3.3% | 0.5% |
| French Orders | ||||||
| Saar exept m/m | MAY-08 | APR-08 | MAR-08 | 3-mo | 6-mo | 12-mo |
| Total | -4.6% | 4.5% | -6.6% | -24.6% | -9.2% | -4.5% |
| Foreign | -8.4% | 5.3% | -6.1% | -32.5% | -12.0% | -8.8% |

Tom Moeller
AuthorMore in Author Profile »Prior to joining Haver Analytics in 2000, Mr. Moeller worked as the Economist at Chancellor Capital Management from 1985 to 1999. There, he developed comprehensive economic forecasts and interpreted economic data for equity and fixed income portfolio managers. Also at Chancellor, Mr. Moeller worked as an equity analyst and was responsible for researching and rating companies in the economically sensitive automobile and housing industries for investment in Chancellor’s equity portfolio. Prior to joining Chancellor, Mr. Moeller was an Economist at Citibank from 1979 to 1984. He also analyzed pricing behavior in the metals industry for the Council on Wage and Price Stability in Washington, D.C. In 1999, Mr. Moeller received the award for most accurate forecast from the Forecasters' Club of New York. From 1990 to 1992 he was President of the New York Association for Business Economists. Mr. Moeller earned an M.B.A. in Finance from Fordham University, where he graduated in 1987. He holds a Bachelor of Arts in Economics from George Washington University.
More Economy in Brief


