 Global| Jul 16 2009
Philadelphia Fed Index Remains Somewhat Weak
by:Tom Moeller
|in:Economy in Brief
Summary
The Philadelphia Federal Reserve Bank indicated that, during July, factory sector activity in the region continued to contract. The rate of decline even quickened versus June as indicated by the Index of General Activity in the [...]
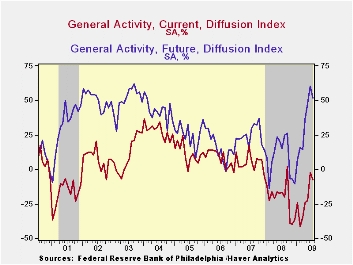
The Philadelphia Federal Reserve Bank indicated that, during July, factory sector activity in the region continued to contract. The rate of decline even quickened versus June as indicated by the Index of General Activity in the manufacturing sector at -7.5 versus -2.2. However, both figures were materially improved from the lows of this past winter. Consensus expectations had been for a July reading of -5.0.
During the last ten years there has been a 77% correlation between the level of the Philadelphia Fed Business Conditions Index and the three-month growth in factory sector industrial production. There has been a 70% correlation with q/q growth in real GDP. The latest survey from the Philadelphia Federal Reserve Bank can be found here.
Amongst the components, both the shipments and employment indexes
turned lower month-to-month but remained up from the March-April lows.
During the last ten years there has been a 79% correlation between the
index level and the m/m change in manufacturing sector payrolls. The
new orders, unfilled orders and average workweek components each
improved to new highs.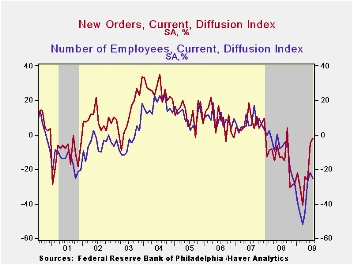
The prices paid index also improved to a less-negative 3.5. During the last ten years there has been a 74% correlation between the prices paid index and the three-month growth in the intermediate goods PPI. There has been an 83% correlation with the change in core intermediate goods prices.
The separate index of expected business conditions in six months also slipped during July after having improved to its highest level since 2003. Most of the index components fell except that expectations for prices paid, employment and inventories rose to new cycle highs.
The figures from the Philadelphia Federal Reserve can be found in Haver's SURVEYS database.
Residential Housing and Personal Bankruptcy from the Federal Reserve Bank of Philadelphia can be found here.
| Philadelphia Fed (%) | July | June | July '08 | 2008 | 2007 | 2006 |
|---|---|---|---|---|---|---|
| General Activity Index | -7.5 | -2.2 | -16.7 | -21.3 | 5.0 | 8.0 |
| Prices Paid Index | -3.5 | -13.0 | 71.3 | 36.4 | 26.3 | 36.7 |
Empire State Factory Conditions Improved To Best In Over One Year
by Tom Moeller July 16, 2009
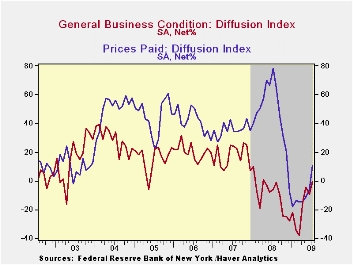
The Federal Reserve Bank of New York reported yesterday that its Empire State Factory Index of General Business Conditions improved to its highest level since April of last year. The latest reading of -0.55 compares to sharply negative levels this past Winter and, thus, suggests that recessionary forces have moderated. The index reached -38.23 this past March and the latest level was better than Consensus expectations for a reading of -5.0.
The Empire State Manufacturing Survey is a monthly survey of manufacturers in New York State. Participants from across the state in a variety of industries respond to a questionnaire and report the change in indicators from the previous month. Respondents also state the likely direction of these same indicators six months ahead. For more on the Empire State Manufacturing Survey, including methodologies and the latest report, click here.
The figure is a diffusion index. Since the series' inception in 2001, there has been a 75% correlation between its level and the three-month change in U.S. factory sector industrial production. Like the Philadelphia Fed Index of General Business Conditions, the Empire State Business Conditions Index reflects answers to independent survey questions; it is not a weighted combination of the components. The series dates back only to 2001.
Improvement in the new orders component paced last month's index
with a gain to the highest level since December of 2007. The shipments
index also improved to its highest since the middle of last year while
the average workweek expanded moderately. The employment index also
improved slightly to the highest level since last October. In the
history of the NY employment index, there has been an 87% correlation
between it and the three-month growth in overall U.S. factory sector
employment as reported by the Labor Department. 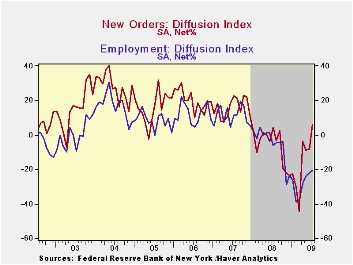
To the downside was a sharp decline in the inventories index, to a series' low, unfilled orders and delivery times.
Prices firmed as indicated by the first positive index reading since November. Nevertheless, the index level remained down sharply from last year. Since inception in 2001, there has been a 76% correlation between the index of prices paid and the three-month change in the core intermediate materials PPI.
The Empire State index of expected business conditions in six months slipped during July from its highest level since mid-2007. The subseries for new orders, shipments, employment and capital expenditures each fell but still remained improved from the winter lows..
The Empire State data is available in Haver's SURVEYS database.
| Empire State Manufacturing Survey | July | June | July '08 | 2008 | 2007 | 2006 |
|---|---|---|---|---|---|---|
| General Business Conditions (diffusion index, %) | -0.55 | -9.41 | -6.16 | -10.10 | 17.23 | 20.24 |
| New Orders | 5.89 | -8.15 | 4.52 | -6.25 | 15.71 | 20.11 |
| Employment | -20.83 | -21.84 | -6.32 | -5.36 | 11.28 | 12.62 |
| Prices Paid | 10.42 | -5.75 | 77.89 | 46.99 | 35.64 | 41.88 |
Sharp Decline In U.S. Claims For Jobless Insurance Suggests Labor Market Improvement
by Tom Moeller July 16, 2009
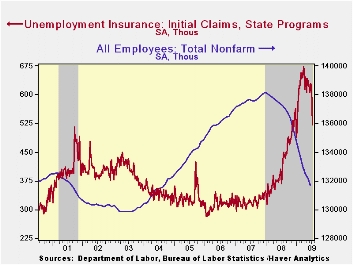
Conditions in the labor market improved further last week as evidenced by a sharp decline in both initial and continuing claims for unemployment insurance. For the second consecutive week, the report on initial claims was surprising. A 47,000 drop to 522,000 which followed a similar decline during the prior week. The latest level was the lowest since the first week of January and it was off from the March peak of 674,000. The four-week average of claims, which smoothes out some of the volatility in the weekly numbers, also fell to 584,000. The latest weekly level was quite a bit lower than Consensus expectations for 554,000.
The Labor Department indicated that the largest decreases in initial claims for the week ending July 4 were in New Jersey (-5,030), California (-4,293), North Carolina (-3,983), Kansas (-3,544), and Oregon (-1,454) while the largest increases were in Michigan (+12,144), New York (+8,913), Wisconsin (+5,838), Indiana (+5,430), and Ohio (+4,240).
Confirming the labor market's improvement was a 642,000 drop in
continuing claims for unemployment insurance to the lowest level since
mid-April. The continuing claims figures lag initial claims by one week
and provide an indication of workers' ability to find employment. At 6,273,000 claims still were nearly double the year ago level. The
four-week average of continuing claims fell back to 6,666,750 which was
the lowest since mid-May. The series dates back to 1966.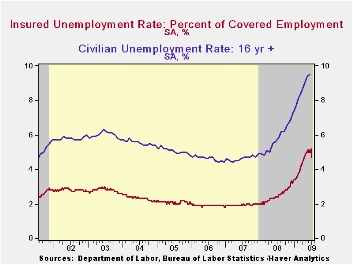
The insured rate of unemployment dropped sharply to 4.7% which was the lowest level since mid-April. During the last ten years there has been a 93% correlation between the level of the insured unemployment rate and the overall rate of unemployment published by the Bureau of Labor Statistics.
The highest insured unemployment rates in the week ending June 27 were in Michigan (7.2 percent), Puerto Rico (6.9), Oregon (6.5), Pennsylvania (6.3), Nevada (6.1), Wisconsin (5.8), California (5.4), South Carolina (5.4), Connecticut (5.2), Illinois (5.2), New Jersey (5.2), and North Carolina (5.2). Rates were lowest in Texas (3.0), Wyoming (3.2), Colorado (3.2), Maine (3.4), Maryland (3.6), Minnesota (4.0), Florida (4.1), Georgia (4.2) and Mississippi (4.3).
The unemployment insurance claims data is available in Haver's WEEKLY database and the state data is in the REGIONW database.
The minutes to the latest FOMC meeting can be found here.
| Unemployment Insurance (000s) | 07/11/09 | 07/04/09 | 06/27/09 | Y/Y | 2008 | 2007 | 2006 |
|---|---|---|---|---|---|---|---|
| Initial Claims | 522 | 569 | 617 | 34.9% | 420 | 321 | 313 |
| Continuing Claims | -- | 6,273 | 6,915 | 97.9% | 3,342 | 2,552 | 2,459 |
| Insured Unemployment Rate (%) | 4.7 | 5.2 | 2.4 | 2.5 | 1.9 | 1.9 |
U.S. Home Builders’ Index Recovers To Its Highest Since June '08
by Tom Moeller July 16, 2009
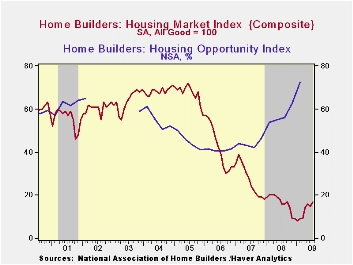
According to the National Association of Home Builders, improvement in the housing market continued during July. Their Composite Housing Market Index recovered the June slip and rose to 17, which equaled the highest level since June of last year. The index is compiled from survey questions asking builders to rate market conditions as “good”, “fair”, “poor” or “very high” to “very low”. Numerical results over 50 indicate a predominance of “good” readings.
Also showing improvement during all of the first quarter was the Home Builders' Housing Opportunity Index, which is the share of homes sold that could be considered affordable to a family earning the median income. It jumped to a record high of 72.5% buoyed by lower home prices, lower interest rates and higher income. (There is a break in the series from 2002 to 2003.)
The Home Builders Association indicated that its sub-index of present sales rose this month to the highest level since June '08. At a reading of 17 the figure was up significantly from the January low of 6. Since 1990, the year-to-year change in this index has had an 80% correlation with the year-to-year percentage change in new single-family home sales.
The index of builders’ expectations for home sales in six months held stable but remained near its highest since September. The “traffic" of prospective buyers also improved from June and was up from the record lows of this past Winter.
The strength in the July composite index readings was concentrated
in the South. Elsewhere in the country composite indexes were
flat-to-lower.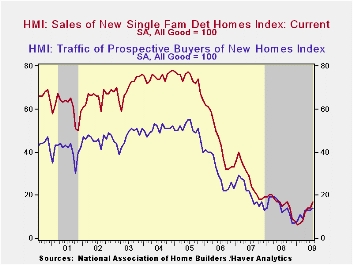
The NAHB has compiled the Housing Market Index since 1985. The weights assigned to the individual index components are .5920 for single family detached sales, present time; .1358 for single family detached sales, next six months; and .2722 for traffic of prospective buyers. The results, along with other housing and remodeling indexes from NAHB Economics, are included in Haver’s SURVEYS database.
Today's House testimony by Fed Governor Elizabeth A. Duke titled Consumer Protection can be found here.
| Nat'l Association of Home Builders | July | June | July '08 | 2008 | 2007 | 2006 |
|---|---|---|---|---|---|---|
| Composite Housing Market Index (All Good = 100) | 17 | 15 | 16 | 16 | 27 | 42 |
| Single-Family Sales | 17 | 14 | 15 | 16 | 27 | 45 |
| Single-Family Sales: Next Six Months | 26 | 26 | 23 | 25 | 37 | 51 |
| Traffic of Prospective Buyers | 14 | 13 | 12 | 14 | 21 | 30 |

Tom Moeller
AuthorMore in Author Profile »Prior to joining Haver Analytics in 2000, Mr. Moeller worked as the Economist at Chancellor Capital Management from 1985 to 1999. There, he developed comprehensive economic forecasts and interpreted economic data for equity and fixed income portfolio managers. Also at Chancellor, Mr. Moeller worked as an equity analyst and was responsible for researching and rating companies in the economically sensitive automobile and housing industries for investment in Chancellor’s equity portfolio. Prior to joining Chancellor, Mr. Moeller was an Economist at Citibank from 1979 to 1984. He also analyzed pricing behavior in the metals industry for the Council on Wage and Price Stability in Washington, D.C. In 1999, Mr. Moeller received the award for most accurate forecast from the Forecasters' Club of New York. From 1990 to 1992 he was President of the New York Association for Business Economists. Mr. Moeller earned an M.B.A. in Finance from Fordham University, where he graduated in 1987. He holds a Bachelor of Arts in Economics from George Washington University.
More Economy in Brief


