 Global| Jun 18 2010
Philadelphia Fed Index: Rate of Business Expansion Slows
by:Tom Moeller
|in:Economy in Brief
Summary
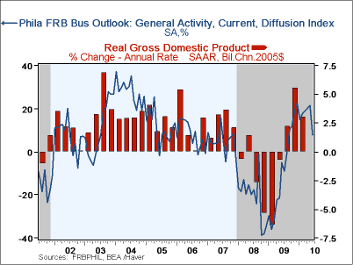
According to the Philadelphia Federal Reserve Bank, the economic recovery continued this month but its rate of expansion slowed. The Bank's June index of regional factory sector activity slipped to 8.0 from 21.4 during May. The latest [...]
 According to the Philadelphia Federal Reserve
Bank, the economic recovery continued this month but its rate of
expansion slowed. The Bank's June index of regional factory sector
activity slipped to 8.0 from 21.4 during May. The latest was well short
of expectations for a reading of 20.0 and it was the lowest figure
since last August. Nevertheless, it compared to readings near -40.0 at
the recent recession's weakest.
During the last ten years there has been an 76% correlation between the level of the Philadelphia Fed Business Conditions Index and the three-month growth in factory sector industrial production. There has been a 78% correlation with q/q growth in real GDP. The latest survey from the Philadelphia Federal Reserve Bank can be found here.
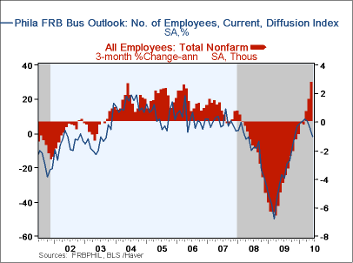
Accompanying the deterioration in the General Activity Index were weaker shipments and much weaker employment & hours readings. During the last ten years, there has been a 75% correlation between the index level and the three-month change in manufacturing sector payrolls.
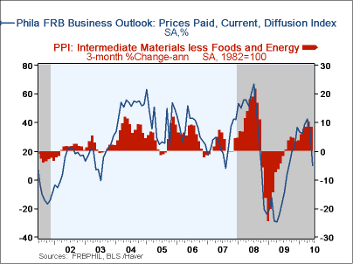
The prices paid index fell sharply to the lowest level since last August. During the last ten years there has been a 70% correlation between the prices paid index and the three-month growth in the intermediate goods PPI. There has been an 81% correlation with the change in core intermediate goods prices.
The separate index of expected business conditions in six months improved modestly m/m but remained well below its earlier high. Expected prices paid also fell to the lowest level since last August. In addition, expected capital expenditures were down m/m to the lowest since September and remained well below the February high.
The figures from the Philadelphia Federal Reserve can be found in Haver's SURVEYS database.
Remarks on "The Squam Lake Report: Fixing the Financial System" by Federal Reserve Chairman Ben S. Bernanke can be found here.
| Philadelphia Fed (%) | June | May | April | June '09 | 2009 | 2008 | 2007 |
|---|---|---|---|---|---|---|---|
| General Activity Index | 8.0 | 21.4 | 20.2 | -5.0 | -7.6 | -21.4 | 5.0 |
| New Orders | 9.0 | 6.1 | 13.9 | -8.8 | -9.7 | -14.7 | 6.9 |
| Shipments | 14.2 | 15.8 | 5.6 | -0.2 | -8.0 | -9.2 | 9.9 |
| Delivery Times | 6.8 | -1.2 | 5.4 | -18.5 | -15.3 | -10.6 | -6.1 |
| Number of Employees | -1.5 | 3.2 | 7.3 | -24.1 | -23.8 | -8.8 | 6.8 |
| Inventories | 4.6 | -7.9 | 2.0 | -18.0 | -24.0 | -16.7 | -3.7 |
| Prices Paid Index | 10.0 | 35.5 | 42.7 | -17.4 | -3.9 | 36.3 | 26.3 |
by Robert Brusca June 18, 2010
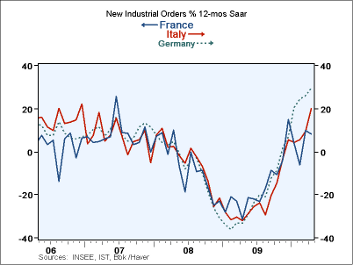 Euro orders: no fries with that burger...New industrial
orders readings from France round out the total for the big three in
EMU. France has showed the most recent weakness with an orders drop of
3.4% in April. After a jackrabbit start, France's order trend has
become erratic in recent months as the graphic demonstrates. But
Germany and Italy continue to show strong trend growth with the German
experience dominant. So orders are on the upswing but not with all the
trimmings.
The upside of the downside...The data in the table (see the two columns at the far right) provide another perspective on the rebound in activity. These columns show several two-year benchmarks for each country that help to set the parameters for assessing the ongoing rebound. For example, orders in France are down the most -at -32% - from their two-year peak. German orders are down the least with a drop of -16.6%. In terms of the rebound Germany outstrips the others with a very strong 36% snap back from its low compared to a 20% gain for Italy and a much milder 8% rise for France. These statistics help you to navigate though the bumpy monthly numbers to better place each of theses nations in their own recovery process.
Much the same down-stroke for all the folk...The big three EMU economies all saw orders fall by about the same amount from peak to trough with Italy's 63.3% being the biggest drop and Germany's 61.1% being the smallest, marking a small range. But Germany is showing the greatest ability to rebound largely because of its ability to exploit rising global demand though its export prowess. France, which has tended to rely more on domestic demand, seems to be hitting a wall in terms of its recovery process while Italy is rising in the footsteps of Germany's strong gain. Despite the fact that when indebted EMU nations are discussed Italy is named right after Ireland and Spain, whatever concerns are out there about Italy they have yet to impact economic performance.
All for growth and growth for all... but not equally-- On balance the Euro expansion at the country level shows signs of strength and of continuing as Germany and Italy perform. However, there are also hints of maturity and slowing in the form of France. Clearly there is still a lot of unused capacity in the Zone so no one is hitting a real wall of any sort; orders are still well off from past peak levels in the big three as well as throughout the Zone. We can peruse these data and see why some have confidence in Europe and why others have reservations. But that sort of variation is also quite typical of economic recovery periods. It's too soon to sound alarms about euro-area growth and not the right time to get complacent about prospects.
What a country wants, what a country gets...With that as background, it is not surprising that the view of the zone is a confused one. The most indebted euro-nations are undertaking austerity measures due to market pressures or to keep from being hemmed in by them. The most fiscally responsible (Germany!) is undertaking its own belt-tightening because it has a history of discipline. But the Zone needs domestic demand and austerity works against that. Germany is pursing its own self-interest not its Zone's best interests.
The spin-doctor is in...I continue to urge euro-observers to look closely at policies and to separate them from rhetoric. It is clear that markets demand action. It is clear that 'governments' see this and have tried to be responsive. It is also clear that when steps are taken the various electorates howl in protest (except in Germany). And that should give us pause about thinking thoughts of how austere Europe will become.
Scylla and Charybdis -Europe will do something, but growth in Europe is not at risk. There simply is no taste for it. So don't look for politicians to do things that will cause them problems. Look, instead, for the rhetoric of austerity to outstrip the action of contraction as politicians try to navigate a successful course (for them) between what markets want and what their respective electorates will stand. Scylla and Charybdis live, but in a new form. It's a very Greek image for this Greek inspired drama, one that, hopefully, can keep from becoming a tragedy.
| Euro-Area Industrial Orders & Sales Trends | ||||||||||
|---|---|---|---|---|---|---|---|---|---|---|
| Saar except m/m | % m/m | Apr 10 |
Apr 10 |
Apr 10 |
Apr 09 |
Qtr-2 Date |
From 2Y |
From 2Y |
||
| Euro-Area Detail | Apr 10 |
Mar 10 |
Feb 10 |
3Mo | 6mo | 12mo | 12mo | Saar | max | Min |
| Germany: | 3.3% | 5.9% | 0.5% | 45.9% | 40.1% | 32.5% | -35.5% | 53.6% | -16.6% | 36.3% |
| France: | -3.4% | 6.3% | -1.2% | 6.1% | 12.4% | 8.4% | -31.1% | 1.1% | -32.0% | 8.4% |
| Italy | 4.7% | 1.1% | -0.2% | 24.2% | 23.6% | 20.2% | -32.0% | 36.7% | -23.2% | 20.2% |
by Carol Stone June 18, 2010
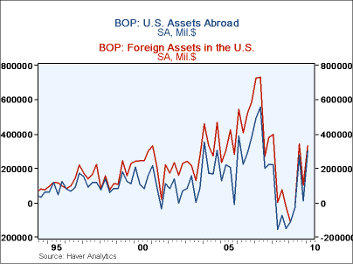 The financial account portion of
yesterday's balance of payments report shows sizable capital flows both
in and out of the United States in Q1. U.S. assets abroad increased on
net by $300.8 billion in the quarter, following a tiny $8.7 billion in
Q4 (revised substantially from $99.1 billion reported before). The
small Q4 amount occurred in government accounts, reflecting more
liquidation of the Federal Reserve's currency swap program. Private
investors had continued investing abroad in Q4, though by a smaller
amount than before, $55.8 billion. They increased their net purchases
of assets aboard by $309.6 billion in Q1, including larger direct
investment outflows and a swing in banks' claims on foreigners from
liquidation in Q4 to a sizable gain in Q1.
Foreign investment in the U.S. picked up in Q1, to $332.1 billion
following more restrained inflows in Q4 of $103.4 billion. The increase
in Q1 was in "other" investment, that is, not official assets. These,
mostly private, investments accelerated to $257.0 billion after a
liquidation of $13.2 billion in Q4. Net purchases of U.S. Treasury
securities by this group surged by $105.4 billion in Q1, in contrast
with the slim gain of $13.8 billion in Q4 and net liquidations the
prior two quarters. Banking activity increased $88.6 billion, turning
around from a $63.8 billion liquidation in Q4. 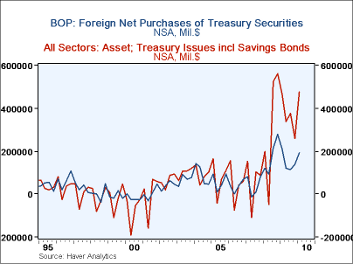 Foreign official assets
in the U.S. increased $75.0 billion in Q1, somewhat less than their
$116.8 billion gain in Q4. Official purchases of Treasuries eased to
$89.1 billion from $124.4 billion in Q4. Overall, foreign buying of
Treasuries amounted to $192.4 billion, up from $139.6 billion. The
largest quarter ever for this item is Q4 2008, which saw $279.5 billion
in foreign purchases.
In the first graph here, we show the financial flows in and out of the U.S. financial system. The balance of payments data have the convention of showing capital outflows with a minus sign, and in graphing U.S. assets abroad here, we multiplied them by -1 to put them on the same side of the axis as foreign assets in the U.S. We see there that flows in both directions are currently running along the same general tracks. In the second graph, we show total foreign purchases of Treasury securities; this comes in the BOP array as the sum of official purchases and other purchases of Treasuries. We compare that with the total net increase in Treasury securities from the Flow-of-Funds data. Despite impressions from press reports, foreign investors have not been buying up every last Treasury bill, note or bond -- domestic investment in them is in fact quite large
The summary of Balance of Payments data is included in Haver's USECON database, with further detail in USINT. The flow-of-funds data is in the FFUNDS database.
Tom Moeller
AuthorMore in Author Profile »Prior to joining Haver Analytics in 2000, Mr. Moeller worked as the Economist at Chancellor Capital Management from 1985 to 1999. There, he developed comprehensive economic forecasts and interpreted economic data for equity and fixed income portfolio managers. Also at Chancellor, Mr. Moeller worked as an equity analyst and was responsible for researching and rating companies in the economically sensitive automobile and housing industries for investment in Chancellor’s equity portfolio. Prior to joining Chancellor, Mr. Moeller was an Economist at Citibank from 1979 to 1984. He also analyzed pricing behavior in the metals industry for the Council on Wage and Price Stability in Washington, D.C. In 1999, Mr. Moeller received the award for most accurate forecast from the Forecasters' Club of New York. From 1990 to 1992 he was President of the New York Association for Business Economists. Mr. Moeller earned an M.B.A. in Finance from Fordham University, where he graduated in 1987. He holds a Bachelor of Arts in Economics from George Washington University.


