 Global| Sep 21 2007
Philadelphia Fed Index Improved
by:Tom Moeller
|in:Economy in Brief
Summary
The Philadelphia Federal Reserve Bank's Index of General Business Conditions in the manufacturing sector improved sharply this month. The rise to 10.9 more than reversed the deterioration down to 0.0 during August. During the last ten [...]
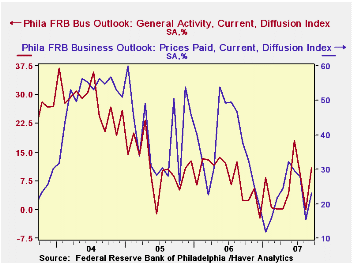
The Philadelphia Federal Reserve Bank's Index of General Business Conditions in the manufacturing sector improved sharply this month. The rise to 10.9 more than reversed the deterioration down to 0.0 during August.
During the last ten years there has been a 65% correlation between the level of the Philadelphia Fed Business Conditions Index and three-month growth in factory sector industrial production. There has been a 43% correlation with q/q growth in real GDP.
The sub indexes for new orders and inventories accounted for most of the rise in the overall index. Shipments improved only marginally while the indexes for unfilled orders and employment both fell. During the last ten years there has been a 75% correlation between the employment index and the three-month growth in factory payrolls.
The business conditions index reflects a separate survey question, not the sub indexes.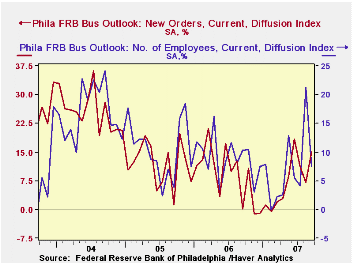
The prices paid index reversed some of its deterioration in August but remained near its low since February. During the last ten years there has been a 76% correlation between the prices paid index and the three-month growth in the intermediate goods PPI. There has been an 85% correlation with the change in core intermediate goods prices.
The separate index of expected business conditions in six months fell slightly but remained near its best level since late in 2004. Expectations for new orders were quite firm and though expectations for the number of employees fell from its recent high, it remained firm.
Subprime Side Effects in the Federal Funds Market from the Federal Reserve Bank of St. Louis can be found here.
| Philadelphia Fed Business Outlook | September | August | Sept. ‘06 | 2006 | 2005 | 2004 |
|---|---|---|---|---|---|---|
| General Activity Index | 10.9 | 0.0 | 2.3 | 8.1 | 11.5 | 28.1 |
| Prices Paid Index | 23.1 | 15.4 | 46.6 | 36.6 | 40.1 | 51.2 |
by Robert Brusca September 21, 2007
Slip-slidin’ away…
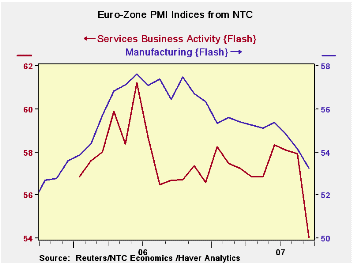
The chart on the left tells the story. The table below gives the perspective on the trend with more precision. Anyway you slice it, the release of the Reuters NTC PMI FLASH! readings for the Euro area tell a grim story…the weakest readings in 21 months. That is since its inception for the services measure taking the MFG PMI back to January 2000, so as to include a recession, raises the range ranking of the MFG PMI to the 70th percentile or the top 30%. That is better but it falls short of being called ‘strong’ or robust. If we were grading papers a 70 would be a C-minus.
And this is a September reading that predates the recent push up in the Euro. We have heard Germany’s wise man Bofinger talk of the potential for FX intervention. Intervention was a topic of the speech to today by the ECBs Bini Smaghi. Airbus has warned of adverse strong-euro effects. The currency game is in full swing.
Who’s at risk: Who Da man?While everyone gnashes their teeth for the poor, poor dollar let’s remember that it’s the strong currency country that really get hurt.
Look at Japan’s decade-long torpor after the too-strong yen. Maybe Europe should spend more time worrying about its own polices instead of the US. Since the US has been denied any control of some its most important FX rates as Japan has wallowed in weak growth and borrowing that cheapie has mushroomed into a cottage industry of massive proportions and since China has asserted its right to commandeer its bilateral peg with the dollar, stress has been left fall elsewhere. Euro anyone?
From jubilation to frustration. We have watched with interest as Europe has chortled over the rise of the euro and as that has segued into a view of the literal invincibility of its growth even as the termites have set about their work on those wooden arguments.
Some have talked of switching reserves into euro. Well be careful what you wish for. Now Europe looks in horror at what is happening. This is a continent based on exporting. Exports are typically high; 40% of GDP in Germany and higher in other countries there. A too-high exchange rate is not the sort of collateral problem for Europe that it has been in the US with export more like 10% to 15% of GDP. And, as we have written before, the trouble with being a reserve center currency is that you need a lot of flexibility in your economy to deal with the swing in capital flows that might arise. So despite the fact that those who have shifted into euro may now be happy the real question is this: for how long?
A one-two punch? For Europe the FX rise is taking its toll in concert with the impact from the financial situation everyone said would not spread. The Bank of England was for a while stubborn about its own building crisis (a gathering storm?). But it has had to cave and offer so much assistance that Mr. King is now being crowned (in the pejorative sense) by the Select Committee looking into those matters.
One in repair, one in despair. The ECB is now taking blasts from its favorite critic, Mr Sarcastic, err Sarkozy. While the dollar is floundering, it is in shallow water. As I remind people of this key question: from here how far can the dollar fall and against what? Meanwhile, back at the Euro-ranch, real trouble is brewing and it does not have a good solution. Talk of FX intervention is a pea shooter against a charging elephant. No trained Mahoot would stand in the way of that charging beast, let alone with a pea shooter for a weapon. It is fair to say that the US is in state of repair and Europe is in a state of despair. So much for the fate of the poor dollar… Dollar rules! Euro drools! Why? Because the dollar and US economy can survive this sort of things since IT IS A REAL RESERVE UNIT with all the trappings. The euro, sadly, is not.
| FLASH Readings | ||
|---|---|---|
| NTC PMIs for the Euro area 13 | ||
| MFG | Services | |
| Sep-07 | 53.23 | 54.04 |
| Aug-07 | 54.16 | 57.91 |
| Averages | ||
| 3-Mo | 54.08 | 56.68 |
| 6-Mo | 54.67 | 57.01 |
| 12-Mo | 55.41 | 57.14 |
| 21-Mo Range | ||
| High | 57.61 | 61.21 |
| Low | 53.23 | 54.04 |
| % Range | 0 | 0 |
by Robert Brusca September 21, 2007
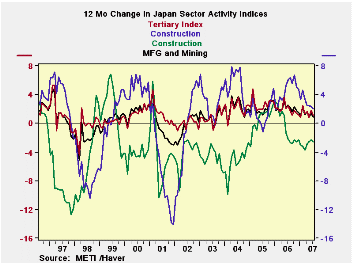
Construction sector is on its LIFETIME LOW – since 1993.
The chart on the left shows the 12-month momentum in Japan’s various key sectors. Among them, only construction is contracting and it has been doing that since mid -2006. Construction is at the its lifetime low point. Other sectors are relatively high in their respective ranges – in their 90th percentiles. But momentum is fading across these sectors. MFG is only gradually losing momentum while the tertiary sector (services) has less momentum to start and is also losing it faster. The all industry measure tracks the tertiary sector closely.
| Japan Main Industry Surveys | |||||||||
|---|---|---|---|---|---|---|---|---|---|
| Recent Months | Moving Averages | Extremes: Range | |||||||
| Jul 2007 |
Jun 2007 |
May 2007 |
3Mo | 6Mo | 12Mo | Max | Min | %-Tile | |
| All Industry | 107.1 | 107.5 | 107.3 | 107.3 | 107.2 | 106.9 | 107.6 | 93.1 | 1.0 |
| Construction | 78.7 | 80 | 81.6 | 80.1 | 80.3 | 80.4 | 124.6 | 78.7 | 0 |
| Mining and MFG | 108.1 | 108.5 | 107.1 | 107.9 | 107.8 | 107.9 | 109.6 | 87.7 | 0.9 |
| Tertiary | 109.7 | 110.3 | 110.2 | 110.1 | 110.0 | 109.5 | 110.7 | 91 | 0.9 |
| Ranges, Max, Min since 1993 | |||||||||
by Carol Stone September 21, 2007
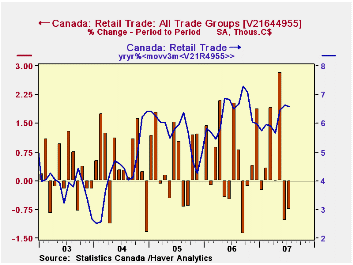
Retail trade in Canada fell 0.8% in July following on a 1.1% drop in June. May had been stronger, with a 2.8% increase. The July result year-on-year was up 3.8%. This was the weakest y/y increase since October 2005, although the monthly swings in these growth rates make it a bit misleading to characterize the one month; the y/y change in a 3-month moving average, by contrast, was 6.6%, roughly in line with recent experience.
Several store groups shared the pattern of a strong May followed by decreases in June and July. The automotive sector, which accounts for about 34% of retail sales in Canada, gained 4.3% in May, but then fell 2.9% in June and 1.3% in July. But others duplicated this: home centers and hardware stores, clothing, and general merchandise, as examples.
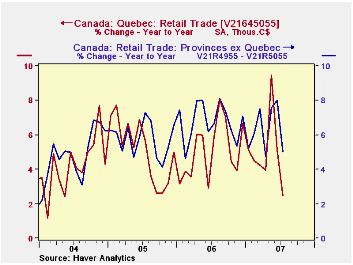
The strength in May's sales was believed by Statistics Canada and private analysts to be largely attributable to a government-worker pay settlement received by women in Quebec, one of a series of "pay equity" settlements achieved by unions and/or reflecting national legislation concerning salaries of women and men. 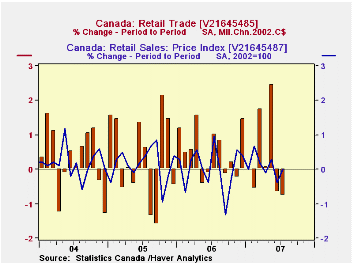 Sales in Quebec then were up 5.0% in May and they fell 4.1% in June and 0.7% in July. Sales among all the other Provinces, though, still rose 2.2% in May, so not all of the push was due to the payout to Quebec's workers.
Among other of the big Provinces, Ontario saw 2.1% growth in May and then declines of 0.5% in June and 1.9% in July. Alberta sales rose 2.9% in May and 0.6% in June; they edged down 0.2% in July.
On a volume basis, sales showed the same monthly pattern. In chained 2000 C$, they rose 2.5% in May and fell back 0.7% in June and 0.8% in July. Prices were thus not the major reason for the swing in nominal sales. In May, the retail trade price index rose just 0.3%; it declined 0.4% in June and was flat in July.
As we noted at the outset, while these sales look to be slowing if July alone is compared to year-ago figures, it really does seem too early to conclude that the trend is shifting. However, the trend in the Canadian economy looks to be quite sensitive to the path of this key measure of consumer demand over the next month or two.
The national data for Canada are contained in Haver's CANSIM database, with that for the Provinces in CANSIMR.
| CANADA (% Chg) | Jul 2007* | Jun 2007* | May 2007* | Year Ago | 2006 | 2005 | 2004 |
|---|---|---|---|---|---|---|---|
| Retail Trade: All Groups | -0.8 | -1.1 | 2.8 | 3.8 | 6.4 | 5.6 | 4.7 |
| All Motor Vehicles & Parts Dealers | -2.3 | -3.6 | 5.0 | 3.7 | 6.0 | 5.0 | 0.1 |
| Total less MV & P | 0.3 | 1.9 | 0.1 | 4.7 | 6.4 | 6.5 | 6.2 |
| Gasoline Stations | -3.5 | 4.7 | 5.3 | 0.2 | 9.1 | 15.4 | 11.4 |
| Total less MV & P and Gasoline | 0.9 | 1.5 | -0.6 | 5.4 | 5.9 | 5.2 | 5.5 |

Tom Moeller
AuthorMore in Author Profile »Prior to joining Haver Analytics in 2000, Mr. Moeller worked as the Economist at Chancellor Capital Management from 1985 to 1999. There, he developed comprehensive economic forecasts and interpreted economic data for equity and fixed income portfolio managers. Also at Chancellor, Mr. Moeller worked as an equity analyst and was responsible for researching and rating companies in the economically sensitive automobile and housing industries for investment in Chancellor’s equity portfolio. Prior to joining Chancellor, Mr. Moeller was an Economist at Citibank from 1979 to 1984. He also analyzed pricing behavior in the metals industry for the Council on Wage and Price Stability in Washington, D.C. In 1999, Mr. Moeller received the award for most accurate forecast from the Forecasters' Club of New York. From 1990 to 1992 he was President of the New York Association for Business Economists. Mr. Moeller earned an M.B.A. in Finance from Fordham University, where he graduated in 1987. He holds a Bachelor of Arts in Economics from George Washington University.
More Economy in Brief


