 Global| Jul 21 2005
Philadelphia Fed Activity Index Recovered, Expectations Dreary
by:Tom Moeller
|in:Economy in Brief
Summary
The July Index of General Business Conditions in the manufacturing sector from the Philadelphia Fed recovered the prior month's drop and returned to positive territory. The 11.8 point m/m increase to 9.6 pulled the index to its [...]
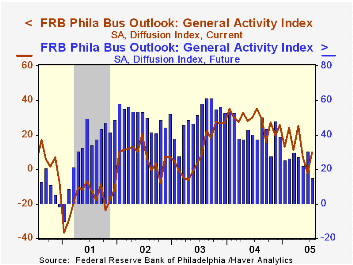
The July Index of General Business Conditions in the manufacturing sector from the Philadelphia Fed recovered the prior month's drop and returned to positive territory. The 11.8 point m/m increase to 9.6 pulled the index to its highest since April. Consensus expectations had been for a reading of 9.0 in July.
During the last ten years there has been a 68% correlation between the level of the Philadelphia Fed Business Conditions Index and three month growth in factory sector industrial production. There has been a 50% correlation with q/q growth in real GDP.
Improvement in shipments, unfilled orders and delivery lead times raised the July index. The orders index also did increase but just modestly while the index covering the number of employees fell to 3.4, the lowest since late 2003. During the last ten years there has been a 64% correlation between the employment index and the three month growth in factory payrolls.
The business conditions index reflects a separate survey question, not the sub indexes.
The separate index of expected business conditions in six months halved versus June. At 15.3 the index was at its lowest level since early 2001.
The prices paid index rose slightly to 26.5 but remained at half the level of one year ago. During the last ten years there has been a 75% correlation between the prices paid index and the three month growth in the intermediate goods PPI. The correlation with the finished goods PPI has been 50% and with the CPI it's been 43%.
The Philadelphia Fed index is based on a survey of 250 regional manufacturing firms, but these firms sell nationally and internationally.
The latest Business Outlook survey from the Philadelphia Federal Reserve Bank can be found here.
| Philadelphia Fed Business Outlook | July | June | July '04 | 2004 | 2003 | 2002 |
|---|---|---|---|---|---|---|
| General Activity Index | 9.6 | -2.2 | 35.5 | 28.1 | 10.6 | 7.7 |
| Prices Paid Index | 26.5 | 23.5 | 50.2 | 51.3 | 16.8 | 12.3 |
by Tom Moeller July 21, 2005
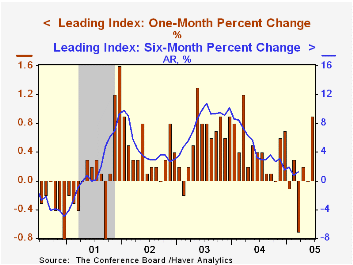
The June Composite Index of Leading Economic Indicators reported by the Conference Board rose 0.9%. Revisions to the prior two months raised May to no change from a 0.5% decline reported initially and April to plus 0.2% from no change. Six-month growth in the leaders improved to 0.6%.
The method of calculating the contribution to the index from the interest rate yield spread was revised. A negative contribution will now occur only when the spread inverts rather than when declining as in the past. More details could be found here.
Amongst the 10 components of the leading index the breadth of one month gain improved markedly to 80%, the highest since October 2003. In June, only a decline in new orders for nondefense capital goods made a negative contribution.
The leading index is based on eight previously reported economic data series. Two series, orders for consumer goods and orders for capital goods, are estimated.
The coincident indicators rose by 0.2% (2.8% y/y), continuing the steady up trend in place since early 2003.
The June lagging indicators rose 0.3% and the prior month's gain was revised up to 0.4%.
Visit the Conference Board's site for coverage of leading indicator series from around the world.
Monetary Policy Report to the Congress from the US Federal Reserve Board is available here.
| Business Cycle Indicators | June | May | 6-Month Chg | 2004 | 2003 | 2002 |
|---|---|---|---|---|---|---|
| Leading | 0.9% | 0.0% | 1.2% | 7.7% | 5.1% | 5.0% |
| Coincident | 0.2% | 0.1% | 0.3% | 2.7% | 0.4% | -0.6% |
| Lagging | 0.3% | 0.4% | 5.8% | -0.1% | -0.1% | -0.7% |
by Tom Moeller July 21, 2005
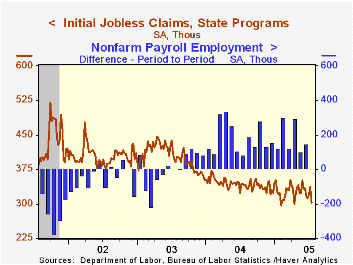
Initial claims for unemployment insurance dropped a sharp 34,000 to 303,000 last week after a 16,000 increase the week earlier which was little revised. The latest figure is the lowest since mid-April. Consensus expectations had been for 328,000 claims.
The latest also covers the survey period for July nonfarm payrolls and fell 13,000 (4.1%) from the June period.
During the last ten years there has been a (negative) 75% correlation between the level of initial claims for unemployment insurance and the monthly change in payroll employment. There has been a (negative) 65% correlation with the level of continuing claims.
The four week moving average of initial claims dropped to 318,00 (-6.3% y/y), the lowest level since early March.
Continuing claims for unemployment insurance reversed about all of the prior week's increase with a 41,000 decline.
The insured unemployment rate fell back to the four year low of 2.0%.
Age and Education Effects on the Unemployment Rate from the Federal Reserve Bank of San Francisco can be found here.
| Unemployment Insurance (000s) | 07/16/05 | 07/09/05 | Y/Y | 2004 | 2003 | 2002 |
|---|---|---|---|---|---|---|
| Initial Claims | 303 | 337 | -11.9% | 343 | 402 | 404 |
| Continuing Claims | -- | 2,577 | -8.8% | 2,926 | 3,531 | 3,570 |
by Carol Stone Revised Commentary July 21, 2005
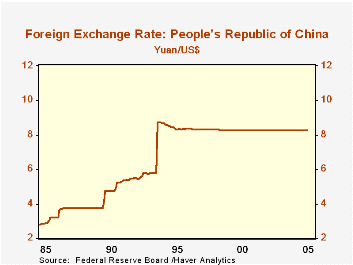
After pegging its currency to the US dollar (a policy not without some irony) for almost exactly 10 years, the People's Bank of China announced this morning that it would allow the yuan to float against "a basket of currencies". It immediately reduced the exchange rate with the dollar from 8.28 to 8.11; inverted, this means a single yuan, formerly worth 12.1¢, is now worth 12.3¢, an increase of 2.1%. The float will be "managed", so presumably abrupt, large increases will be discouraged through intervention. This change took effect at 7:00PM in Beijing, after the close of Chinese markets. Importantly, the yuan is traded only in China, during China's trading hours. It does not trade in Western markets. So the "official" rate governing transactions in goods and services that take place in Western markets which are priced for value July 21 remains 8.2765. This is the rate that appears, for example, on the New York Fed's schedule of "Noon Buying Rates" that is dated today, July 21. The new rate will appear on quote sheets for tomorrow, July 22. Each day, the People's Bank of China will announce a rate at the close of Chinese trading which will apply for the following Chinese business day, a practice similar to the form of this announcement.
News stories cited pressure from governments in some major regions of the world as a reason the Chinese chose to act. The share of Chinese goods in world markets is growing rapidly, and there have already been efforts toward protectionism. The US, for one, continues to struggle to form a policy over Chinese textiles. The rapid inroads being made by Chinese goods are readily apparent in the table below.
It is perhaps no coincidence that the Chinese action was taken on the same day as the release of June trade data by Japan. Japan's trade surplus shrank to ¥873 million from ¥1.141 billion in June 2004. Some 45% of the deterioration involved trade with China. Chinese imports are now 21.0% of total Japanese imports, up a percentage point in market share over the past year and up 2.7 percentage points from the average for 2002.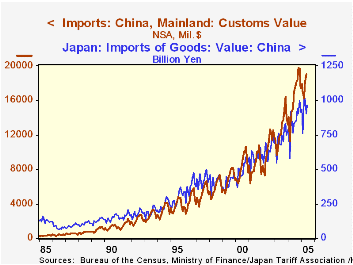
Other markets feel the same kind of penetration: in the US, imports from China were 14.1% of the total in May, up 1.4 percentage points from a year ago. In the Euro-Zone, the gain in share was 1.2 percentage points. Both of these regions are seeing a steep uptrend in the inflow of Chinese goods.
This has not been all bad. As we've noted here earlier this week, one of the offsets to rising energy costs has been falling textile and clothing prices. Clothing has been ever more cheaper in many parts of the world, a boon to lower-income nations as well as those that are better off. Hopefully, this will not all disappear with this action, but the policy change should help rebalance global trade. Further, perhaps the Chinese believe that this will help them with the politics that are involved in their recently proposed direct investment transactions in the US and elsewhere.
| Imports from China | June 2005 | May 2005 | Year Ago | 2004 | 2003 | 2002 |
|---|---|---|---|---|---|---|
| Japan: Bil ¥, NSA | 4606.8 | 4502.1 | 4148.6 | 4101.4 | 3696.8 | 3519.0 |
| China | 967.9 | 907.7 | 831.2 | 849.9 | 727.6 | 644.0 |
| Share (%) | 21.0 | 20.2 | 20.0 | 20.6 | 19.7 | 18.3 |
| US: Bil $, NSA | -- | 135.5 | 118.3 | 122.5 | 104.8 | 96.8 |
| China | -- | 19.1 | 15.1 | 16.4 | 12.7 | 10.4 |
| Share (%) | -- | 14.1 | 12.7 | 13.3 | 12.1 | 10.7 |
| Euro-Zone: Bil €, SA | -- | 97.5 | 86.9 | 89.4 | 82.4 | 82.1 |
| China | -- | 9.3 | 7.3 | 7.7 | 6.2 | 5.2 |
| Share (%) | -- | 9.6 | 8.4 | 8.3 | 7.5 | 6.3 |

Tom Moeller
AuthorMore in Author Profile »Prior to joining Haver Analytics in 2000, Mr. Moeller worked as the Economist at Chancellor Capital Management from 1985 to 1999. There, he developed comprehensive economic forecasts and interpreted economic data for equity and fixed income portfolio managers. Also at Chancellor, Mr. Moeller worked as an equity analyst and was responsible for researching and rating companies in the economically sensitive automobile and housing industries for investment in Chancellor’s equity portfolio. Prior to joining Chancellor, Mr. Moeller was an Economist at Citibank from 1979 to 1984. He also analyzed pricing behavior in the metals industry for the Council on Wage and Price Stability in Washington, D.C. In 1999, Mr. Moeller received the award for most accurate forecast from the Forecasters' Club of New York. From 1990 to 1992 he was President of the New York Association for Business Economists. Mr. Moeller earned an M.B.A. in Finance from Fordham University, where he graduated in 1987. He holds a Bachelor of Arts in Economics from George Washington University.
More Economy in Brief


