 Global| May 05 2009
Petroleum Prices Move Higher
by:Tom Moeller
|in:Economy in Brief
Summary
Regular gasoline prices last week moved higher to $2.08 per gallon, up 47 cents from the December low. Yesterday, prices moved higher still. The spot market price for a gallon of unleaded gasoline reached $1.52 on Monday, up from [...]
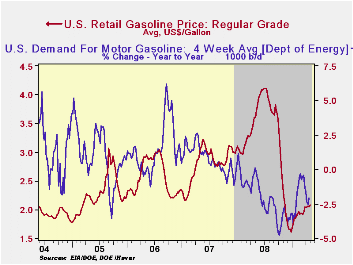
Regular gasoline prices last week moved
higher to $2.08 per gallon, up 47 cents from the December low.
Yesterday, prices moved higher still. The spot market price for a
gallon of unleaded gasoline reached $1.52 on Monday, up from $1.38
averaged last week and it was the highest price since early November.
The figures are reported by the U.S. Department of Energy and can be
found in Haver's WEEKLY & Daily databases.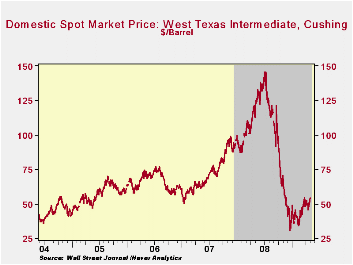
The rise in gasoline prices has been driven, in part, by higher crude oil prices. Prices averaged $51.07 last week for a barrel of West Texas Intermediate. Though that still was down slightly from the late-March high of $53.09, prices remained up from the December low of $32.37 per barrel. Prices reached a high of $145.66 last July. Yesterday, prices strengthened even further to $54.47. The latest increases occurred despite a 4.9% rise in crude oil production versus last year. The figures on crude oil production and inventories are available in Haver's Weekly Oil Statistics database.
Higher gasoline prices and economic weakness have lowered miles-driven, though the rate of decline has eased. Gasoline demand last week fell 2.1% y/y versus the 4.8% rate of decline seen last October. The change in demand is measured using the latest four weeks versus the same four weeks in 2008. Demand for all petroleum products was down 6.8% y/y led by a 41.5% drop in demand for residual fuel oil and a 13.5% drop in distillate demand. These numbers are available in Haver's OILWKLY database.
The price of natural gas continued to move lower to $3.29 per mmbtu (-69.4% y/y), down with the end of the winter heating season. At the lowest level since 2002, the latest average price was down by three-quarters from the high reached in early-July of $13.19/mmbtu.
The April 2009 Senior Loan Officer Opinion Survey on Bank Lending Practices from the Federal Reserve Board is available here.
| Weekly Prices | 05/04/09 | 04/27/09 | Y/Y | 2008 | 2007 | 2006 |
|---|---|---|---|---|---|---|
| Retail Regular Gasoline ($ per Gallon, Regular) | 2.08 | 2.05 | -42.5% | 3.25 | 2.80 | 2.57 |
| Light Sweet Crude Oil, WTI ($ per bbl.) | 51.07 | 47.83 | -55.7% | 100.16 | 72.25 | 66.12 |
by Tom Moeller May 5, 2009
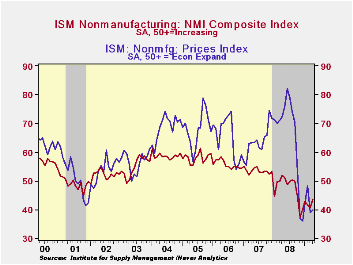
The service sector recovered its earlier losses last month. The April Composite Index for the nonmanufacturing sector from the Institute for Supply Management (ISM) rose to 43.7 last month from an unrevised reading of 40.8 during March. The latest was the highest level since October of last year and it was higher than Consensus expectations for a reading of 42.0. A level of the ISM index below 50 indicates declining activity. Since the series' inception in 1997 there has been a 48% correlation between the level of the business activity index in the nonmanufacturing sector and the Q/Q change in real GDP for the services and the construction sectors.
Improved new orders led last month's gain in the overall ISM
index. The orders index rose by nearly ten points from March to the
highest level since the Fall. An index which measures the speed of
vendor deliveries continued to suggest slack and fell sharply to its
lowest level in the series' history which dates back to 1997.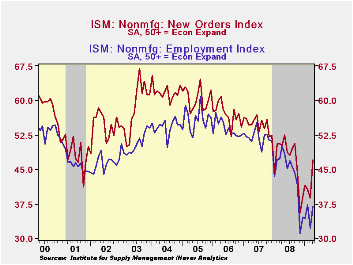
The business activity sub-index also rose further last month to its highest level since last September. That rise came as the employment index made up its March decline and settled near its highest level in six months. Since the series' inception in 1997 there has been a 56% correlation between the level of the ISM nonmanufacturing employment index and the m/m change in payroll employment in the service-producing plus the construction industries.
Pricing power continued under pressure. Though the price index ticked up slightly from March, it remained near its lowest level. Since its inception ten years ago, there has been a 60% correlation between the price index and the q/q change in the GDP services chain price index.
Beginning with the January 2008 Nonmanufacturing Report On Business®, the composite index is calculated as an indicator of the overall economic condition for the non-manufacturing sector. It is a composite index based on the diffusion indices for four of the indicators (business activity, new orders, employment and supplier deliveries) with equal weights. The latest report from the ISM can be found here.
ISM surveys more than 370 purchasing managers in more than 62 industries including law firms, hospitals, government and retailers. The nonmanufacturing survey dates back to July 1997.
Today's testimony by Fed Chairman Ben S. Bernanke titled The Economic Outlook can be found here.
| ISM Nonmanufacturing Survey | April | March | April '08 | 2008 | 2007 | 2006 |
|---|---|---|---|---|---|---|
| Composite Index | 43.7 | 40.8 | 51.9 | 47.4 | 53.5 | 55.7 |
| Prices Index | 40.0 | 39.1 | 72.2 | 66.0 | 63.8 | 65.3 |
by Tom Moeller May 5, 2009
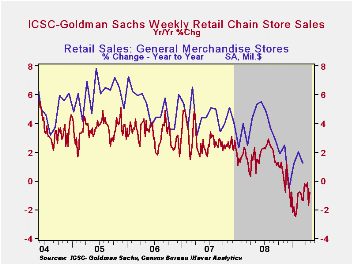
Consumer spending recently has taken a firmer stance. Despite
the news of weaker sales of light motor vehicle sales last month, chain
store sales moved to a firmer footing. According to the International
Council of Shopping Centers-Goldman Sachs Index store sales rose 0.7%
last week and made up the decline of the prior period. The news for the
full-month, however, is more encouraging. Added to increases early in
the month, chain store sales for all of April rose 1.4% from the March
average following that month's tepid 0.3% uptick.
During the last ten years there has been a 64% correlation between the year-to-year growth in chain store sales and the growth in general merchandise sales. These weekly figures are available in Haver's SURVEYW database.
The ICSC-Goldman Sachs retail chain-store sales index is constructed using the same-store sales (stores open for one year) reported by 78 stores of seven retailers: Dayton Hudson, Federated, Kmart, May, J.C. Penney, Sears and Wal-Mart.
Moreover, the outlook for sales continued cautiously optimistic. The leading indicator of sales has been moving sideways since early February. While still negative, the year-to-year change has improved to a negative 2.0%, up from the 6% rate of decline last Fall.
A Minsky Meltdown: Lessons for Central Bankers from the Federal Reserve Bank of San Francisco can be found here.
| ICSC-UBS (SA, 1977=100) | 05/02/09 | 04/25/09 | Y/Y | 2008 | 2007 | 2006 |
|---|---|---|---|---|---|---|
| Total Weekly Chain Store Sales | 491.3 | 488.0 | -0.8% | 1.4% | 2.8% | 3.3% |
by Robert Brusca May 5, 2009
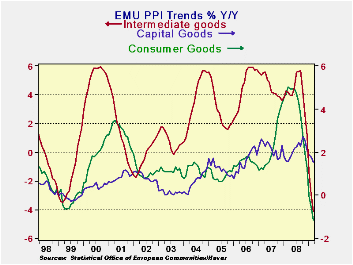
The PPI is not the ECB’s mandated inflation variable. The
central bank prefers the broader consumer-based HICP. But the drop in
the PPI excluding construction at -0.8% in March, at -10.5% over three
months (saar), at -12.3% over 6 months (saar) and at a minus three
percent over 12-months is nonetheless a compelling piece of evidence
for the ECB to confront. Capital goods inflation at +1.5% Yr/Yr is the
high inflation reading for the three main sectors. Consumer goods
prices are lower by 1.2% over 12-months and intermediate goods prices
are lower by 4.1% over 12-months. Europeans are not as worried about
deflation as policymakers in the US, yet they can’t deny these trends.
Inflation, its breadth and its trends all point to the nearly
complete absence of anything that could be called inflation. Indeed
there is growing evidence for those who want to worry about that
opposite concern: deflation. On top of that, the European economy is
very weak.
The controversial aspect of this is that Europe’s finance
ministers are not applying any new stimulus and the head of the
European Commission, Jean-Claude Junker, said that no policies except
those that are already approved should be implemented. That appears to
be an oblique warning from Junker to EU countries not to go off on
their own with any new programs of assistance. Even so Junker admits to
a growing unemployment crisis in Europe. Of course Europe has a more
extensive social safety network than the US. But as the EU Commission
and the OECD and the IMF have cuts forecasts the EU Commission has been
prepared to sit idle and wait for the results of its past stimulus
plans to play out. Moreover, the ECB has been content to let the Bank
of England and the Federal Reserve take the more aggressive monetary
policy actions.
So if there is a risk it is that Europe is getting behind the
curve and perhaps, along with that, a growing risk of deflation. The
continuing sharp drop in inflation – indeed, persisting negative rates
of inflation- hint at an ongoing economic unraveling. However, recent
economic data have suggested in several ways that the economic tailspin
had begun to enter a more controlled phase.
In Spain, programs to arrest sharply rising unemployment seem
to be having some impact. In Germany a car scrappage scheme seems to
have boosted car registrations. The EU PMI for manufacturing shows a
rise in that key sensitive cyclical index that suggests the pace of
economic unraveling its slowing and that signal is echoed across Main
EMU countries. So while Europe’s policies may tread a riskier path that
those in the US there is also some evidence of economic responsiveness
to the counter cyclical policies already implemented and of course
there is that cushier social safety net in Europe.
Nonetheless, this drop in the PPI is sharp, the largest drop
in 22 years. It is putting pressure on the ECB and is expected to
result in another rate cut from Europe’s central bank at its next
meeting. Reasons to oppose such a drop are increasingly scarce.
| E-Area and UK PPI Trends | ||||||
|---|---|---|---|---|---|---|
| M/M | Saar | |||||
| E-Area | Mar-09 | Feb-09 | 3-Mo | 6-MO | Yr/Yr | Y/Y Yr Ago |
| Total x Construct | -0.8% | -0.6% | -10.5% | -12.3% | -3.0% | 5.7% |
| Capital Gds | -0.2% | 0.1% | -0.6% | 0.0% | 1.5% | 1.6% |
| Consumer Gds | -0.2% | -0.2% | -5.0% | -4.2% | -1.2% | 5.0% |
| Intermediate&Cap Gds | -0.9% | -1.0% | -14.1% | -13.8% | -4.1% | 4.2% |
| MFG | -0.9% | -0.5% | -8.8% | -13.6% | -5.1% | 5.8% |
| Germany | -0.7% | -0.7% | -10.2% | -6.4% | 1.0% | 3.2% |
| Gy ExEnergy | -0.5% | -0.5% | -5.9% | -5.7% | -1.4% | 2.4% |
| Italy | -0.8% | -0.8% | -10.1% | -14.5% | -4.5% | 6.6% |
| UK | -0.9% | 0.0% | 1.3% | -15.2% | 0.2% | 13.6% |
| E-zone Harmonized PPI ex construction | ||||||
| The EA 13 countries are Austria, Belgium, Finland, France, Germany, Greece, Ireland, Italy, Luxembourg, the Netherlands, Portugal, Slovenia | ||||||

Tom Moeller
AuthorMore in Author Profile »Prior to joining Haver Analytics in 2000, Mr. Moeller worked as the Economist at Chancellor Capital Management from 1985 to 1999. There, he developed comprehensive economic forecasts and interpreted economic data for equity and fixed income portfolio managers. Also at Chancellor, Mr. Moeller worked as an equity analyst and was responsible for researching and rating companies in the economically sensitive automobile and housing industries for investment in Chancellor’s equity portfolio. Prior to joining Chancellor, Mr. Moeller was an Economist at Citibank from 1979 to 1984. He also analyzed pricing behavior in the metals industry for the Council on Wage and Price Stability in Washington, D.C. In 1999, Mr. Moeller received the award for most accurate forecast from the Forecasters' Club of New York. From 1990 to 1992 he was President of the New York Association for Business Economists. Mr. Moeller earned an M.B.A. in Finance from Fordham University, where he graduated in 1987. He holds a Bachelor of Arts in Economics from George Washington University.
More Economy in Brief


