 Global| Mar 03 2003
Personal Income Stable, Spending Down
by:Tom Moeller
|in:Economy in Brief
Summary
Personal income rose slightly less in January than Consensus expectations for a 0.4% gain. The 0.3% rise was the sixth consecutive monthly increase at that rate. During the last two months, stability in income growth has been fostered [...]
Personal income rose slightly less in January than Consensus expectations for a 0.4% gain. The 0.3% rise was the sixth consecutive monthly increase at that rate.
During the last two months, stability in income growth has been fostered by strength in other transfer payments, proprietors' and labor income. Growth in wages and salaries softened in January to 0.1% (3.5% y/y) following a 0.2% December gain.
Personal consumption expenditures fell instead of rising 0.2% as expected. Durable goods purchases fell 5.7% (1.0% y/y) as motor vehicle purchases dropped sharply. Spending on nondurable goods rose a strong 1.3% (5.5% y/y). Spending on services rose 0.4% (5.1% y/y).
Disposable personal income rose 0.3% (5.2% y/y).
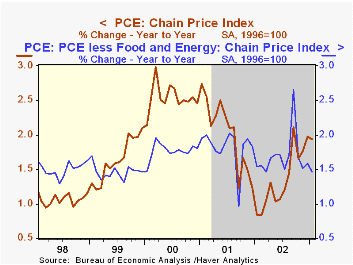
The PCE price deflator rose modestly. Less food and energy the price deflator fell slightly (1.5% y/y) following three consecutive 0.1% monthly gains.
| Disposition of Personal Income | Jan | Dec | Y/Y | 2002 | 2001 | 2000 |
|---|---|---|---|---|---|---|
| Personal Income | 0.3% | 0.3% | 4.2% | 3.0% | 3.3% | 8.0% |
| Personal Consumption | -0.1% | 1.0% | 4.7% | 4.5% | 4.5% | 7.0% |
| Savings Rate | 4.3% | 3.9% | 3.6% | 3.9% | 2.3% | 2.8% |
| PCE Price Deflator | 0.1% | 0.1% | 1.9% | 1.4% | 2.0% | 2.5% |
by Tom Moeller March 3, 2003
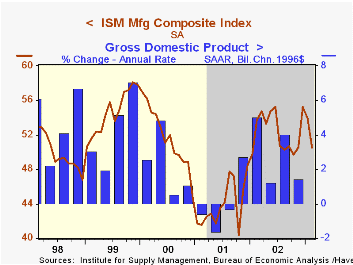
The ISM Composite Index of manufacturing sector activity fell more than expected last month. Nevertheless, it was the fourth consecutive month the index was above 50, thus indicating expansion in factory sector activity.
During the last twenty years there has been a 65% correlation between the level of the ISM index and quarterly growth in real GDP. There has been an 81% correlation between the index and industrial production growth during that period.
Four of the five component series declined last month, each for the second consecutive month. The vendor delivery index rose (indicating slower delivery speeds) and is up moderately from the low in December.
The separate index of inflation pressure rose to the highest level since July. This index is not seasonally adjusted.
| ISM Manufacturing Survey | Feb | Jan | Y/Y | 2002 | 2001 | 2000 |
|---|---|---|---|---|---|---|
| Composite Index | 50.5 | 53.9 | 53.8 | 52.4 | 44.0 | 51.7 |
| Prices Paid Index | 65.5 | 57.5 | 41.5 | 58.0 | 42.9 | 64.8 |
by Tom Moeller March 3, 2003
The value of construction put in place rose much more than expected in January and December figures were revised up. January marked the fourth consecutive month of a strong gain in construction. Consensus expectations were for only a very slight rise.
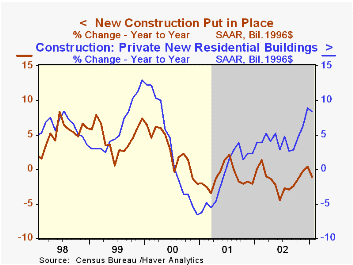
In constant 1996 dollars, overall construction spending rose 0.8% (-1.1% y/y). Real residential spending surged for the fourth month, up 1.5% (8.3% y/y). Real nonresidential activity fell 0.9% (-16.6% y/y) for the second consecutive monthly decline.
In nominal terms, residential building expenditures on one-unit structures surged 3.5% (16.1% y/y), the fifth consecutive month of strong gain. Spending on multi-unit structures also has risen sharply in the last two months (3.1% y/y).
Nonresidential building activity fell moderately last month led lower by widespread category declines except industrial. Spending on industrial buildings rose for the third consecutive month (-34.8% y/y).
Public construction rose led by another notable increase in housing & redevelopment (22.4% y/y), industrial (46.7% y/y) and highways and streets (-5.8% y/y.
During the last twenty years there has been a 98% correlation between the y/y percent change in real construction spending on residential buildings and the change in real residential investment in the GDP accounts.
| Construction Put-in-place | Jan | Dec | Y/Y | 2002 | 2001 | 2000 |
|---|---|---|---|---|---|---|
| Total | 1.7% | 1.5% | 2.1% | 0.7% | 2.5% | 7.3% |
| Residential | 2.5% | 3.3% | 12.2% | 6.9% | 3.3% | 7.4% |
| Nonresidential | -0.3% | -2.1% | -14.9% | -16.3% | -3.1% | 7.1% |
| Public | 1.0% | 0.6% | 0.6% | 6.4% | 7.4% | 5.4% |

Tom Moeller
AuthorMore in Author Profile »Prior to joining Haver Analytics in 2000, Mr. Moeller worked as the Economist at Chancellor Capital Management from 1985 to 1999. There, he developed comprehensive economic forecasts and interpreted economic data for equity and fixed income portfolio managers. Also at Chancellor, Mr. Moeller worked as an equity analyst and was responsible for researching and rating companies in the economically sensitive automobile and housing industries for investment in Chancellor’s equity portfolio. Prior to joining Chancellor, Mr. Moeller was an Economist at Citibank from 1979 to 1984. He also analyzed pricing behavior in the metals industry for the Council on Wage and Price Stability in Washington, D.C. In 1999, Mr. Moeller received the award for most accurate forecast from the Forecasters' Club of New York. From 1990 to 1992 he was President of the New York Association for Business Economists. Mr. Moeller earned an M.B.A. in Finance from Fordham University, where he graduated in 1987. He holds a Bachelor of Arts in Economics from George Washington University.
More Economy in Brief


