 Global| Nov 27 2002
Personal Income Modest
by:Tom Moeller
|in:Economy in Brief
Summary
Personal income (4.2% AR, YTD) rose as expected last month. It was the weakest gain in income since a slight decline in July. September's figure was unrevised Wage and salary disbursements were unchanged (3.0% AR, YTD) following 0.6% [...]
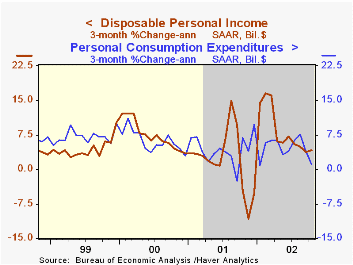
Personal income (4.2% AR, YTD) rose as expected last month. It was the weakest gain in income since a slight decline in July. September's figure was unrevised
Wage and salary disbursements were unchanged (3.0% AR, YTD) following 0.6% gains in both the prior two months. Wages in the goods-producing industries fell 0.3% and are down YTD. Personal transfer payments were unchanged (9.2% YTD, AR). Personal interest income fell for the fourth straight month (0.8% YTD, AR).
Personal consumption expenditures (4.7% YTD, AR) rose slightly more than expected and began 4Q 0.2% above the 3Q average. Durable goods purchases fell a sharp 1.0% following a 5.0% September drop. Unit sales of light vehicles plunged in both months. Spending on nondurable goods rose 0.7%, recovering after two months of decline. Spending on services also rose a firm 0.5% (5.4% YTD, AR).
Disposable personal income rose 0.2% (8.3% YTD, AR) following two months of solid gain. Personal tax payments fell for the eighth month this year.
The PCE price deflator rose 0.2% for the third month in a row. Prices were up 2.3% (YTD, AR). Less food and energy, the price deflator rose only 0.1% (1.8% YTD, AR).
| Disposition of Personal Income | Oct | Sept | Y/Y | 2001 | 2000 | 1999 |
|---|---|---|---|---|---|---|
| Personal Income | 0.1% | 0.4% | 4.1% | 3.3% | 8.0% | 4.9% |
| Personal Consumption | 0.4% | -0.4% | 3.7% | 4.5% | 7.0% | 6.7% |
| Savings Rate | 4.2% | 4.4% | 0.3% | 2.3% | 2.8% | 2.7% |
| PCE Price Deflator | 0.2% | 0.2% | 1.7% | 2.0% | 2.5% | 1.6% |
by Tom Moeller November 27, 2002
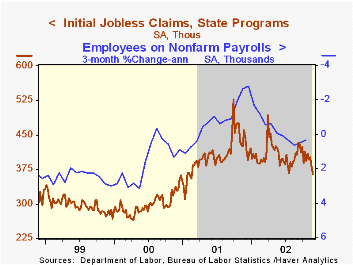
Initial claims for unemployment insurance fell more than expected in the latest week and were at the lowest level since early last year. Claims in the prior week were revised up slightly.
The recent sharp decline in initial claims may reflect aberrant seasonal adjustment factors as well as genuine improvement in the labor market.The four-week moving average of initial claims dropped to 385,750, down 11.8% y/y.
Continuing claims for unemployment insurance rose a sharp 2.6%, more than recovering the sharp decline in the prior week which was deepened.
The insured rate of unemployment rose slightly to 2.9%.
| Unemployment Insurance (000s) | 11/23/02 | 11/16/02 | Y/Y | 2001 | 2000 | 1999 |
|---|---|---|---|---|---|---|
| Initial Claims | 364.0 | 381.0 | -21.0% | 405.8 | 299.8 | 297.7 |
| Continuing Claims | -- | 3,650 | 4.9% | 3,021 | 2,114 | 2,186 |
by Tom Moeller November 27, 2002

Durable goods orders last month rose twice Consensus expectations for a 1.5% rise. The steep decline in September was lessened slightly.
Orders for nondefense capital goods recovered some of their September plunge which was lessened. Importantly, capital goods orders excluding aircraft and parts orders rose 5.3%. That gain recouped all the sharp declines of the prior two months
Civilian aircraft and parts orders fell another 3.3% following a huge 47.6% drop in September. Orders for motor vehicles and parts rose 3.9% and gained back all of the prior two months' declines. Orders excluding all transportation equipment rose 2.4% last month and are up 3.6% YTD.
Orders for computers and electronic products rose 6.2% (-0.9% YTD) following two months of sharp decline. Machinery orders also rose sharply after two months of decline, but still were up 3.0% YTD. Orders for electrical equipment dropped 1.6% and were down 0.4% YTD.
Shipments of durable goods rose 1.2% (3.0% YTD), the first in three months.
Durable inventories fell 0.2% (-4.5% YTD), the thirteenth consecutive monthly decline.
| NAICS Classification | Oct | Sept | Y/Y | 2001 | 2000 | 1999 |
|---|---|---|---|---|---|---|
| Durable Goods Orders | 2.8% | -4.6% | 0.0% | -11.4% | 3.3% | 5.4% |
| Nondefense Capital Goods | 4.2% | -10.7% | 7.9% | -16.5% | 7.9% | 3.9% |
by Tom Moeller November 27, 2002

The Chicago Purchasing Manager’s Index of Business activity rose more than expected in November. Consensus estimates were for moderate rise to 48.5.
The rise recouped virtually all of the declines in the prior two months. Directionally, the gain is sympathetic with other improved activity surveys reported for November including the Philadelphia Fed and Empire State surveys.
An 87% correlation over the last ten years between the Chicago PMI and the ISM Composite Index suggests the ISM index will improve when released next Monday.
The indexes of new orders, production, order backlogs, employment and inventories all rose. The delivery speed index fell to the lowest level since February, indicating that delivery speeds rose.
The prices paid index fell to the lowest level since June.
Visit the Chicago Purchasing Managers website at www.napm-chicago.org.
| Chicago Purchasing Managers Index, SA | Nov | Oct | Y/Y | 2001 | 2000 | 1999 |
|---|---|---|---|---|---|---|
| Business Barometer | 54.3 | 45.9 | 42.7 | 41.4 | 51.8 | 56.5 |
| Prices Paid | 57.2 | 62.0 | 40.3 | 50.5 | 65.6 | 57.6 |
by Tom Moeller November 27, 2002
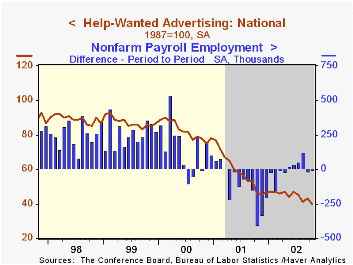
The Conference Board's National Index of Help-Wanted Advertising in October fell to a new cycle low last month. It was the lowest index reading since early 1964.
The proportion of labor markets with rising want-ad volume plummeted to 24% versus 76% in September.
During the last five years there has been a 75% correlation between the level of help-wanted advertising and the monthly change in nonfarm payrolls.
Job opportunities deteriorated in virtually all of the regions of the country.
The figures are seasonally adjusted.
| Conference Board | Oct | Sept | Oct '01 |
|---|---|---|---|
| National Help Wanted Index | 40 | 43 | 46 |
by Tom Moeller November 27, 2002
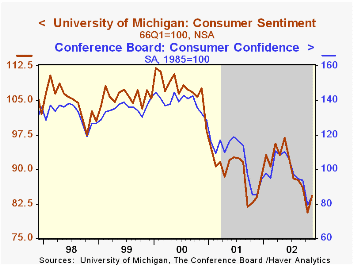
Consumer Sentiment for all of November rose 4.5% from October according to the University of Michigan. The gain was slightly less than expected and did not recoup the sharp decline in October.
Indexes of consumer expectations and current conditions both rose, but the current index rose just slightly.
The University of Michigan survey is not seasonally adjusted.
| University of Michigan | Nov | Oct | Y/Y | 2001 | 2000 | 1999 |
|---|---|---|---|---|---|---|
| Consumer Sentiment | 84.2 | 80.6 | 0.4% | 89.2 | 107.6 | 105.8 |

Tom Moeller
AuthorMore in Author Profile »Prior to joining Haver Analytics in 2000, Mr. Moeller worked as the Economist at Chancellor Capital Management from 1985 to 1999. There, he developed comprehensive economic forecasts and interpreted economic data for equity and fixed income portfolio managers. Also at Chancellor, Mr. Moeller worked as an equity analyst and was responsible for researching and rating companies in the economically sensitive automobile and housing industries for investment in Chancellor’s equity portfolio. Prior to joining Chancellor, Mr. Moeller was an Economist at Citibank from 1979 to 1984. He also analyzed pricing behavior in the metals industry for the Council on Wage and Price Stability in Washington, D.C. In 1999, Mr. Moeller received the award for most accurate forecast from the Forecasters' Club of New York. From 1990 to 1992 he was President of the New York Association for Business Economists. Mr. Moeller earned an M.B.A. in Finance from Fordham University, where he graduated in 1987. He holds a Bachelor of Arts in Economics from George Washington University.
More Economy in Brief


