 Global| Jan 12 2009
OECD LEIS Sink and Signal a MoreImpressive Slowdown
Summary
The outlook for the world's major industrialized and emerging economies worsened markedly in November, according to the monthly OECD Trend adjusted leading indicators. The OECD said the figures point to a "deep slowdown" in the area. [...]
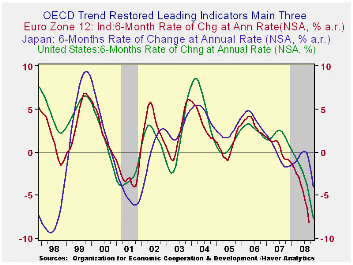
The outlook for the world's major industrialized and emerging
economies worsened markedly in November, according to the monthly OECD
Trend adjusted leading indicators. The OECD said the figures point to a
"deep slowdown" in the area. The Organization for Economic Cooperation
and Development's leading indicator for the Group of Seven advanced
industrial nations fell to 93.3 in November from a confirmed 94.8 in
October. It was a 7.7-point year-on-year drop.
The OECD in characterizing these indicator movements said,
"OECD composite leading indicators for November 2008 point to deep
slowdowns in the major seven economies and in major non-OECD member
economies, particularly China, India and Russia."
The sharpest monthly drop among the G7 economies was Germany's
at 2.0 points, bringing its indicator to 91.6. The smallest drop was in
Italy, which posted a fall of 0.2 points to 95.8. The fall for the G7
as a whole was 1.5 points. Japan's indicator fell 1.6 points
month-on-month to 93.7. Clearly the weakness in the OECD is spread
around. Germany, a country that has been slow to embrace the concept of
slowdown, is now beginning to experience the full brunt of one (based
on data through November).
The indicators for Brazil, China, India and Russia fell at
least as sharply month-on-month as in October, with Russia posting the
largest fall among those emerging economies, a drop of 4.3 points. In
all OECD countries, the G7, and major emerging countries, except
Brazil, the growth cycle outlook was described as a "strong slowdown".
Brazil's was listed as a "downturn".
Clearly previous view that held that the global slowing would
have a muted impact on the fast growing developing economies was wrong.
Indeed, the slide in commodity prices has particularly aggravated the
situation in Russia and other commodity producing countries. There are
no islands of stability.
| OECD Trend-restored leading Indicators | ||||
|---|---|---|---|---|
| Growth progression-SAAR | ||||
| 3-Mos | 6-Mos | 12-Mos | Yr-Ago | |
| OECD | -12.8% | -9.9% | -5.6% | 1.3% |
| OECD 7 | -14.7% | -11.3% | -6.6% | 0.7% |
| OECD Europe | -11.3% | -9.5% | -6.0% | 1.4% |
| OECD Japan | -14.1% | -9.9% | -4.0% | -1.9% |
| OECD US | -17.4% | -12.8% | -7.6% | 1.2% |
| Six month readings at 6-Mo Intervals | ||||
| Recent six | 6-Mos Ago | 12-Mos Ago | 18- Mos Ago | |
| OECD | -9.9% | -1.1% | -0.3% | 3.0% |
| OECD 7 | -11.3% | -1.6% | -1.1% | 2.5% |
| OECD Europe | -9.5% | -2.2% | 0.5% | 2.3% |
| OECD Japan | -9.9% | 2.2% | -2.6% | -1.2% |
| OECD US | -12.8% | -2.1% | -1.4% | 3.8% |
| Slowdowns indicated by BOLD RED | ||||
by Louise Curley January 12, 2009
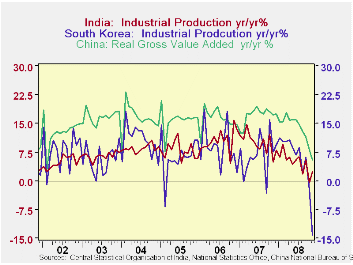
India is the latest Asian country to report industrial production for November of last year. Contrary to expectations, industrial production in India, rose in November from 261.7 in October to 267.2 (Fiscal year beginning April,1993=100). The year over year increase was 2.4% compared with a decline of 0.3% in October. The slight increase is, however, unlikely to reverse the downward trend that has persisted since November 2006
Among other large manufactures in Asia, China has reported a marked deceleration in the growth of its real gross value added (China's surrogate for industrial production) from 8.2% in October to 5.2% in November. South Korea reported a dramatic year over year decline in industrial production of 14.1% in November after a small decline of 2.3% in October. The year over year percent changes in industrial production for the three countries are shown in the attached chart. Growth in industrial production has been decelerating all through 2008 in the three countries, reflecting the global slowdown..
| Industrial Production | Nov 08 | Oct 08 | Sep 08 | 2007 | 2006 | 2005 |
|---|---|---|---|---|---|---|
| India (FY beginning April 1993=100) | 267.2 | 361.7 | 274.7 | -- | -- | -- |
| Year to Year % Change (NSA) | 2.38 | -0.34 | 5.45 | 9.92 | 10.55 | 7.91 |
| South Korea (2005=100) (NSA) | 109.5 | 125.4 | 118.2 | -- | -- | -- |
| Year to Year % Change (NSA) | -14.12 | -2.34 | 6.10 | 6.80 | 8.41 | 6.34 |
| China | -- | -- | -- | -- | -- | -- |
| Year to Year % Change in GVA (NSA) | 5.4 | 8.2 | 5.4 | 17.1 | 16.2 | 15.9 |

Robert Brusca
AuthorMore in Author Profile »Robert A. Brusca is Chief Economist of Fact and Opinion Economics, a consulting firm he founded in Manhattan. He has been an economist on Wall Street for over 25 years. He has visited central banking and large institutional clients in over 30 countries in his career as an economist. Mr. Brusca was a Divisional Research Chief at the Federal Reserve Bank of NY (Chief of the International Financial markets Division), a Fed Watcher at Irving Trust and Chief Economist at Nikko Securities International. He is widely quoted and appears in various media. Mr. Brusca holds an MA and Ph.D. in economics from Michigan State University and a BA in Economics from the University of Michigan. His research pursues his strong interests in non aligned policy economics as well as international economics. FAO Economics’ research targets investors to assist them in making better investment decisions in stocks, bonds and in a variety of international assets. The company does not manage money and has no conflicts in giving economic advice.
More Economy in Brief


