 Global| Apr 08 2020
OECD LEIs Hit the Skids
Summary
As the pandemic takes its toll and as governments and central backs adopt support programs, the OECD leading economic indicators become important gauges to track. These LEI measures are just beginning to roll over and show weakness [...]
 As the pandemic takes its toll and as governments and central backs adopt support programs, the OECD leading economic indicators become important gauges to track. These LEI measures are just beginning to roll over and show weakness because of the suddenness of the hit from government policies adopted to quell the spread of the virus. Because this is an artificially induced slowdown, LEIs did not give off many warning signs. Bam! One day lockdown was simply announced as policy. Only essential businesses were allowed to operate. It was like a bolt of lightning out of the blue, well maybe gray skies…. The abrupt drop in the LEIs shows that loud and clear. And of course, it is way too soon to think that these gauges would speak to the timing of a rebound. The OECD itself prefers to look at signals from the indexes over six months. To accommodate this, the table below shows two ratios the current index to six-months ago and the index of six-months ago relative to six-months before that. Data show unambiguous weakness and weakening trends.
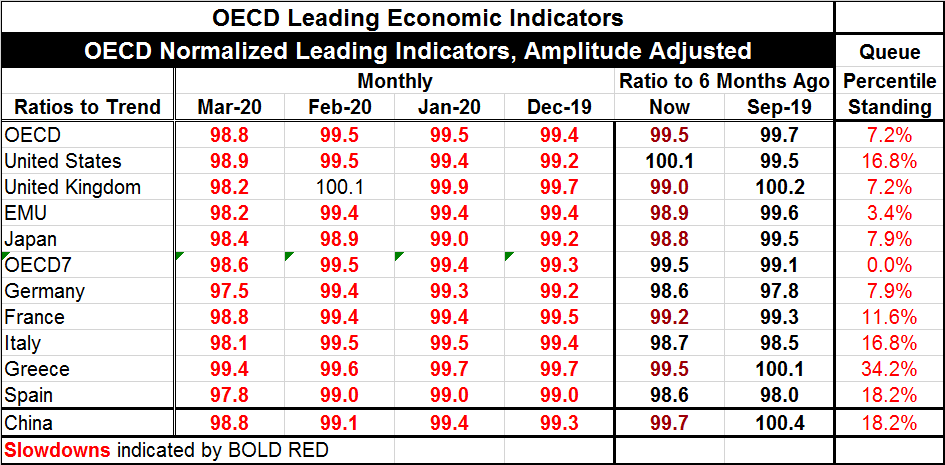
The OECD gauge is constructed so that it rises above 100 when growth begins to trend above its long-run average. Similarly, LEI values below 100 demonstrate weaker than normal growth. And change in the indexes flags acceleration or deceleration in the growth process.
The chart shows that for the EMU, the U.S. and China, the LEIs have been below 100 for a number of months. In these three areas growth peaked somewhere between 2017 and 2018 with slightly different timing for each one. But all were coming off their peaks and slipping in late-2018 with subnormal growth. But by late-2019 or early-2020, there were some scattered signs of stabilization or revival. Possibly there was some optimism that the U.S. and China has signed a Phase I trade deal. But the opportunity to celebrate that was short lived. The virus hit in China and it began to spread and this evolving business cycle upswing was crushed by the sudden collapse of growth as countries acted to quash the spread of the virus by sacrificing growth. The LEIs now memorialize those events.
All indexes in Table OCED Leading Economic Indicators are below 100 signaling below normal growth. Germany and Spain post the weakest readings in March. The ratios of the indexes to six-months ago show slowing everywhere except in the U.S., but the U.S. is just an exception in timing. Japan shows the sharpest slowing on the ratio gauge compared to six-months ago followed closely by the EMU. Over the six-month period previous to that, the U.K. and Greece had picked up, but most countries and regions saw weakening with Germany the hardest hit in that period. Of the eleven countries and regions in the table, all are below their median values since end-1995. All except Greece are in the lower one-fifth of their respective queues of values. As the chart demonstrates, the level of these indexes may not often get weaker but in the Great Recession the levels were substantially weaker so these metrics, unusually weak already, still have a lot of falling left to do.
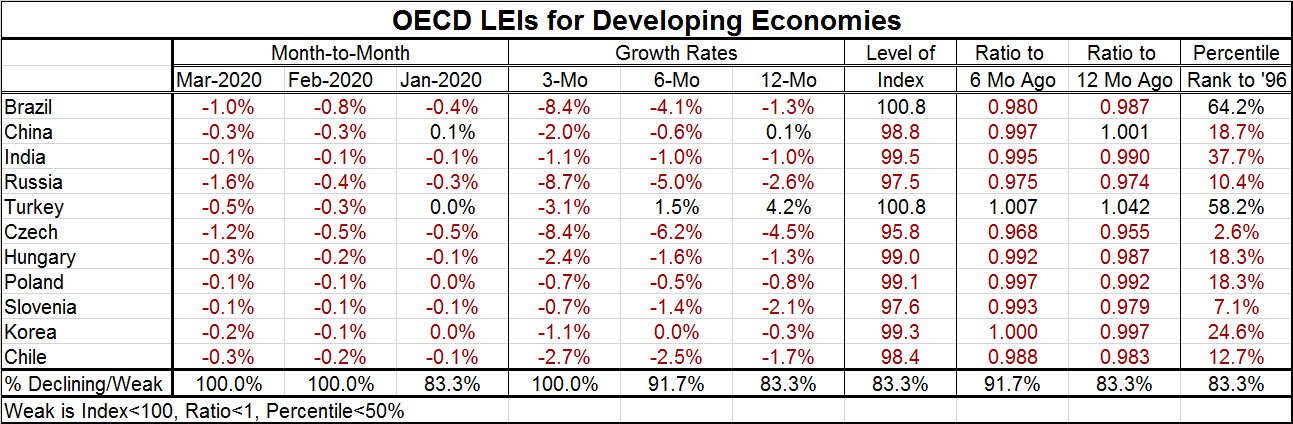
Developing economics show dropping LEIs across the board in March and February, and for all but two entries in January. LEIs are falling over three months everywhere and over six months -- everywhere but Turkey. Over 12 months the LEIs fall everywhere, save Turkey and China. As of March, only Turkey and Brazil have LEI standings above 100 indicating better-than-average growth. The percentile standings are evaluated at the March levels of the LEIs back to December 1995. They show extreme weakness with only Brazil and Turkey in March standing above their median values on that timeline. In fact, of the index levels countries report in March all are below their medians except for Brazil and Turkey.
On balance, the LEIs do not yet give us much information. They are weakening and we know they have a long way to go. We will track their performance and look to see how deep the drop is and when the bottom comes. That will help us to form a gauge for expecting recovery.
France
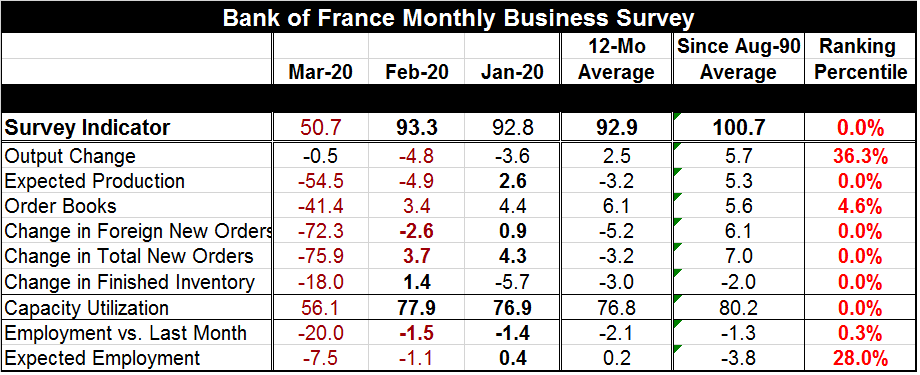
Unrelated to the OECD report, the Bank of France has issued its business survey for March with sharply weakened entries. While I wanted to present the OECD data, I do not want to ignore this stunningly weak report from France. March is the period in which a lot of weakness is cropping up. The BoF has cut its estimate for Q1 growth to -6% upon receipt of this survey (below).
The BoF survey index fell to 50.7 in March from 93.3 in February. Ranked on data back to 1991, the index has never been weaker and four of nine components have never been weaker. No component is even close to its median value (that would occur a 50% ranking). There is no monthly change even remotely similar to the change in the headline gauged in its history: it fell 42.5 points month-to-month. Prior to this month for this survey that goes back to February 1985, the largest month-to-month drop had been less than 10 points.
We are going to see more of these reports giving results 'the likes of which we have never seen before' so get prepared.

Robert Brusca
AuthorMore in Author Profile »Robert A. Brusca is Chief Economist of Fact and Opinion Economics, a consulting firm he founded in Manhattan. He has been an economist on Wall Street for over 25 years. He has visited central banking and large institutional clients in over 30 countries in his career as an economist. Mr. Brusca was a Divisional Research Chief at the Federal Reserve Bank of NY (Chief of the International Financial markets Division), a Fed Watcher at Irving Trust and Chief Economist at Nikko Securities International. He is widely quoted and appears in various media. Mr. Brusca holds an MA and Ph.D. in economics from Michigan State University and a BA in Economics from the University of Michigan. His research pursues his strong interests in non aligned policy economics as well as international economics. FAO Economics’ research targets investors to assist them in making better investment decisions in stocks, bonds and in a variety of international assets. The company does not manage money and has no conflicts in giving economic advice.
More Economy in Brief


