 Global| Jan 13 2012
OECD LEIs
Summary
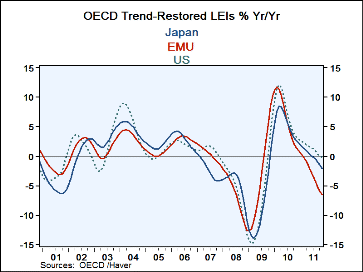
OECD LEIs – The trend-adjusted LEIs are lower nearly across the board in November - the US is the exception as its index rose; Japan’s, hovering above 100, stayed the same. The indicator ratios-to-trend, however, are below 100 [...]
 OECD LEIs – The trend-adjusted LEIs are lower nearly across the board in November - the US is the exception as its index rose; Japan’s, hovering above 100, stayed the same. The indicator ratios-to-trend, however, are below 100 (ratio*100) for most coutnries pointing to an ongoing slowdown. So far, the ratio-to-trend values are modest; Italy is the weakest of the lot at 98.5, 1.5 percentage points below its trend.
The OECD data show slippage relative to trend; when the current indicator falls too far below trend it becomes a recession signal. Greece has been below trend for over 20-months, a time period long enough that it has clearly bent its trend lower. Thus the weak numbers for Grcces reflect more dire circumstances than elsewhere where the basic trends genrally have more uplift.
Spain, while slowing, continues to post a ratio that is about 100.
Itlay has slipped below 100 and is below that mark for five months in a row.
As for the laregest EMU members, France is below 100 for four months in a row; Germany for two months in a row.
Europe has slowed and is slowing. The OECD data are up-to-date through November. They have not yet spoken on the impact of the bounce we have seen in some euro-indicators at year-end. But the messagge in the OECD report is quite clear. There is a slowdown in force and it is not yet giving off recession signals. Contraily the US and Japan (Japan with its own legacy of blunted trends...) are getting stronger while the rest are staying about the same.
| OECD Trend-Restored Leading Indicators | ||||||
|---|---|---|---|---|---|---|
| Growth:M/M | Growth Progression-SAAR | |||||
| Nov-11 | Oct-11 | 3Mos | 6Mos | 12mos | Yr-Ago | |
| OECD | -0.1% | -0.2% | -2.7% | -4.3% | -2.4% | 2.4% |
| OECD7 | -0.1% | -0.3% | -3.3% | -5.2% | -2.7% | 2.1% |
| OECD.Ezone | -0.5% | -0.7% | -7.8% | -9.2% | -6.5% | 1.4% |
| OECD.Japan | -0.2% | -0.2% | -3.1% | -4.1% | -2.2% | 2.6% |
| OECD US | 0.2% | 0.0% | 0.0% | -2.6% | -0.2% | 3.2% |
| Ratios to Trend | ||||||
| Monthly | 6Mo Ago | 12Mo Ago | ||||
| Ratios to Trend | Nov-11 | Oct-11 | Sep-11 | Aug-11 | May-11 | Nov-10 |
| US | 100.5 | 100.4 | 100.4 | 100.5 | 101.0 | 100.4 |
| UK | 99.1 | 99.4 | 99.7 | 100.0 | 101.0 | 101.4 |
| Japan | 100.4 | 100.4 | 100.5 | 100.5 | 100.8 | 100.5 |
| EMU | 99.2 | 99.4 | 99.6 | 99.9 | 101.0 | 101.6 |
| Germany | 99.2 | 99.5 | 99.9 | 100.3 | 101.5 | 101.9 |
| France | 99.1 | 99.2 | 99.5 | 99.8 | 101.0 | 101.8 |
| Italy | 98.5 | 98.7 | 98.9 | 99.3 | 100.5 | 101.5 |
| Greece | 98.7 | 98.5 | 98.4 | 98.3 | 98.3 | 98.9 |
| Spain | 100.0 | 100.1 | 100.2 | 100.3 | 100.6 | 101.1 |
| Slowdowns indicated by RED | ||||||
Robert Brusca
AuthorMore in Author Profile »Robert A. Brusca is Chief Economist of Fact and Opinion Economics, a consulting firm he founded in Manhattan. He has been an economist on Wall Street for over 25 years. He has visited central banking and large institutional clients in over 30 countries in his career as an economist. Mr. Brusca was a Divisional Research Chief at the Federal Reserve Bank of NY (Chief of the International Financial markets Division), a Fed Watcher at Irving Trust and Chief Economist at Nikko Securities International. He is widely quoted and appears in various media. Mr. Brusca holds an MA and Ph.D. in economics from Michigan State University and a BA in Economics from the University of Michigan. His research pursues his strong interests in non aligned policy economics as well as international economics. FAO Economics’ research targets investors to assist them in making better investment decisions in stocks, bonds and in a variety of international assets. The company does not manage money and has no conflicts in giving economic advice.
More Economy in Brief
 Global| Feb 05 2026
Charts of the Week: Balanced Policy, Resilient Data and AI Narratives
by:Andrew Cates


