 Global| May 10 2007
OECD Leading Indicators
Summary
While there has been a lot talk above a de-linking of Europe from the US, a rather careful look at the LEIs plotted on the left shows that at least in terms of these signals the US usually calls the tune and the rest of the OECD [...]
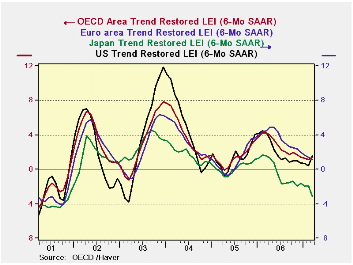
While there has been a lot talk above a de-linking of Europe from the US, a rather careful look at the LEIs plotted on the left shows that at least in terms of these signals the US usually calls the tune and the rest of the OECD marches behind. There is NO EVIDENCE of the rest of the world pulling the US up. Instead, it is the US pulling itself up by its own bootstraps while the rest of the world is still under downward pressure in the lexicon of the OECD indicators. The Euro area is slowing. Japan remains quite weak. Meanwhile, the US is showing new life in the OECD framework.
This chart is DEBUNKING the idea of DE-LINKING.
The table below shows that OECD trends point to continuing weakness for Europe and Japan as well as for the whole of the Euro area. Meanwhile the US is signaling rebound and that has helped the OECD area to show some technical improvement.
The top portion of the table labeled ‘progressive growth rates’ shows slightly more weakness that the bottom that looks at spaced 6-month trends. This discrepancy tells us that the weakness is still more new than it is entrenched. And fortunately the US is pulling out ahead of the pack.
I am much more comfortable with the notion that the US is recovering and that will carry Europe than with the notion that Europe will grow and support the US. I don’t believe in the tooth fairy or in de-linking.
| Growth Progression-SAAR | ||||
| 3Mos | 6Mos | 12mos | Yr-Ago | |
| OECD | 1.7% | 1.8% | 1.2% | 3.5% |
| OECD Big 7 | 0.3% | 0.8% | 0.3% | 2.8% |
| OECD.Europe | 0.6% | 1.2% | 1.7% | 3.6% |
| OECD.Japan | -5.0% | -3.0% | -2.9% | 1.4% |
| OECD US | 2.2% | 2.1% | 0.7% | 3.4% |
| Six-Month Readings at 6-Month Intervals: | ||||
| Recent six | 6Mo Ago | 12Mo Ago | 18MO Ago | |
| OECD | 1.8% | 0.7% | 4.9% | 2.1% |
| OECD Big 7 | 0.8% | -0.2% | 4.2% | 1.4% |
| OECD.Europe | 1.2% | 2.2% | 4.9% | 2.4% |
| OECD.Japan | -3.0% | -2.7% | 1.4% | 1.4% |
| OECD US | 2.1% | -0.7% | 5.6% | 1.1% |
| Slowdowns indicated by bold red | ||||

Robert Brusca
AuthorMore in Author Profile »Robert A. Brusca is Chief Economist of Fact and Opinion Economics, a consulting firm he founded in Manhattan. He has been an economist on Wall Street for over 25 years. He has visited central banking and large institutional clients in over 30 countries in his career as an economist. Mr. Brusca was a Divisional Research Chief at the Federal Reserve Bank of NY (Chief of the International Financial markets Division), a Fed Watcher at Irving Trust and Chief Economist at Nikko Securities International. He is widely quoted and appears in various media. Mr. Brusca holds an MA and Ph.D. in economics from Michigan State University and a BA in Economics from the University of Michigan. His research pursues his strong interests in non aligned policy economics as well as international economics. FAO Economics’ research targets investors to assist them in making better investment decisions in stocks, bonds and in a variety of international assets. The company does not manage money and has no conflicts in giving economic advice.
More Economy in Brief


