 Global| Mar 14 2005
OECD Leading Economic Index Up Again
by:Tom Moeller
|in:Economy in Brief
Summary
The Leading Index of the Big 7 OECD economies rose 0.2% in January for the third consecutive month. The steady rise lifted six month growth in the index to its best since September. During the last ten years there has been a 69% [...]
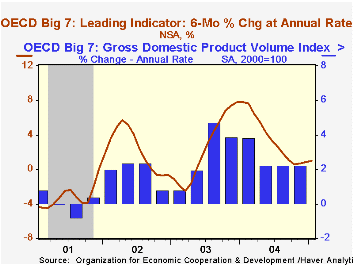
The Leading Index of the Big 7 OECD economies rose 0.2% in January for the third consecutive month. The steady rise lifted six month growth in the index to its best since September.
During the last ten years there has been a 69% correlation between the q/q change in the GDP Volume Index for the Big Seven countries in the OECD and the change in the leading index.
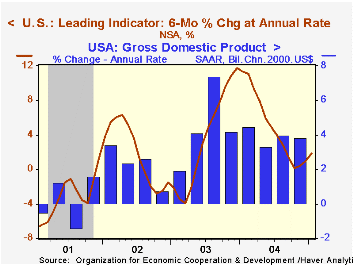
The leading index for the US economy provided the lift to the OECD composite as it increased 0.6% in January for the third consecutive monthly rise following three down months. Six month growth improved to 1.9% from a low of 0.1% in October due to higher share prices, consumer sentiment and construction which offset a tighter yield curve.The leaders for Japan stuttered with no change in January but six month at 1.3% remained up from zero in September due to gains in share prices and construction that offset a tighter yield curve.
Growth in the leaders for the UK economy went even more negative as higher short term interest rates and poorer export prospects offset increases in consumer confidence and share prices.The Canadian leaders rose for the first month following seven consecutive months of decline and growth remained a negative 2.2%.
A second 0.1% monthly decline in the leaders for the European Union (15 countries) pulled the six month growth rate to 0.9%, it's weakest since mid-2003. Growth in the leaders for Germany dropped to 1.5%, down from 8.6% in December 2003, due to a negative yield curve, a poor business climate and a negative orders inflow. The French leaders' also steadily deteriorated and growth went slightly negative versus the high of 8.4% early in 2004 due to a tighter yield curve and few job vacancies The leaders' in Italy fell 0.2% for the second month and six month growth fell to -0.5% due to higher short term interest rates, negative consumer confidence and deteriorating terms of trade.
The latest OECD Leading Indicator report can be found here.
This 2003 report from the US Federal Reserve Board gives An Empirical Analysis of Inflation in OECD Countries. 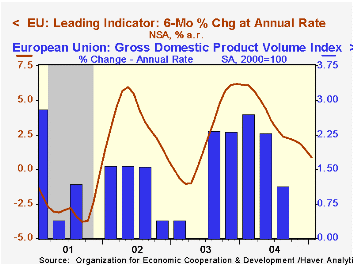
| OECD | Jan | Dec | Y/Y | 2004 | 2003 | 2002 |
|---|---|---|---|---|---|---|
| Composite Leading Index | 102.54 | 102.32 | 1.0% | 101.97 | 97.50 | 96.34 |
| 6 Month Growth Rate | 1.0% | 0.8% | 3.6% | 2.5% | 2.3% |
by Louise Curley March 14, 2005
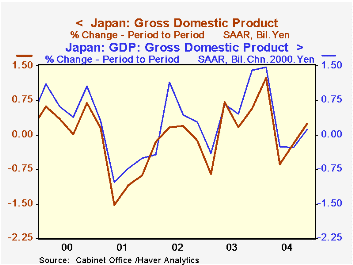
Japan's second estimate of last year's fourth quarter Real Gross Domestic Product changed the previously reported decline of 0.12% from the third to the fourth quarter to an increase of 0.20%. In nominal terms, the second estimate shows a rise of 0.25% compared with the first estimate of 0.02%. There were many and large changes in the earlier estimate but it is still not clear that Japan is on the start of a steady upward path. There is, however, a hint that deflation may ending or at least waning. The revised data show that for the second consecutive quarter, the increase in the nominal value of GDP was less negative or exceeded the increase in real value. The percentage changes in real and nominal GDP are shown in the attached chart.
In the table below we show the first and second estimates of the increases in the yen value of the components of nominal GDP. The changes in the nominal figures are additive whereas those expressed in chained yen are not.
An improved picture of consumption and a somewhat smaller decline in net exports emerge from the revisions. The revised figures show a smaller decline in private consumption,-424.3 billion yen vs.-535.4 billion yen, and a bigger increase in government consumption.790.0 billion yen vs. 566.4 billion yen. Net exports contributed a smaller negative to GDP, largely because imports were overstated in the first estimate. But the significance of the changes in the data relating to the business sector are less clear cut.Fixed investment was weaker than earlier estimated, but inventory accumulation was extremely strong. Fixed investment declined by 117.5 billion yen instead of the 532.6 billion rise estimated earlier and inventories rose by 1,087.5 billion yen in contrast to the 92.4 billion yen decline estimated earlier. Growth based on inventory accumulation is tentative at best.
| Absolute Change in Nominal GDP (Billion Yen) | Old | Q4 2004 | Q3 2004 | Q2 2004 | Q1 2004 |
|---|---|---|---|---|---|
| Total | 106.9 | 1240.4 | -932.2 | -3284.6 | 6246.9 |
| Private Consumption | -535.4 | -424.3 | -607.3 | -72.8 | 1651.8 |
| Government Consumption | 566.4 | 790.0 | 914.6 | 752.2 | 817.0 |
| Fixed Investment | 532.6 | -117.5 | -378.8 | -1722.4 | 471.6 |
| Inventory Change | -92.4 | 1087.5 | 13.4 | -1803.5 | 285.4 |
| Net Exports | -364.2 | -95.4 | -994.7 | -437.9 | 452.3 |
| Percent Change in Nominal GDP | 0.25 | -0.18 | 0.65 | 1.25 | |
| Percent Change in Real GDP | 0.12 | -0.28 | -0.26 | 1.47 |

Tom Moeller
AuthorMore in Author Profile »Prior to joining Haver Analytics in 2000, Mr. Moeller worked as the Economist at Chancellor Capital Management from 1985 to 1999. There, he developed comprehensive economic forecasts and interpreted economic data for equity and fixed income portfolio managers. Also at Chancellor, Mr. Moeller worked as an equity analyst and was responsible for researching and rating companies in the economically sensitive automobile and housing industries for investment in Chancellor’s equity portfolio. Prior to joining Chancellor, Mr. Moeller was an Economist at Citibank from 1979 to 1984. He also analyzed pricing behavior in the metals industry for the Council on Wage and Price Stability in Washington, D.C. In 1999, Mr. Moeller received the award for most accurate forecast from the Forecasters' Club of New York. From 1990 to 1992 he was President of the New York Association for Business Economists. Mr. Moeller earned an M.B.A. in Finance from Fordham University, where he graduated in 1987. He holds a Bachelor of Arts in Economics from George Washington University.
More Economy in Brief


