 Global| Jun 12 2006
OECD Leaders Up Again
by:Tom Moeller
|in:Economy in Brief
Summary
The April Leading Index of the major 7 OECD economies rose 0.2% following a downwardly revised 0.1% increase during March. The leaders have risen 3.4% since the low last April and despite the recent slow gains, the six month growth [...]
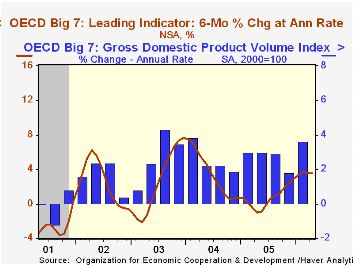
The April Leading Index of the major 7 OECD economies rose 0.2% following a downwardly revised 0.1% increase during March. The leaders have risen 3.4% since the low last April and despite the recent slow gains, the six month growth rate of the index remained firm at 3.5%.
During the last ten years there has been a 64% correlation between the change in the leading index and the q/q change in the GDP Volume Index for the Big Seven OECD countries.
The leading index in Japan jumped 0.7% and that raised the index's six month growth rate to 3.2%, its best in over two years. Share prices and loans-to-deposits were firm as was construction of dwellings. The leaders' correlation with Japan's real economic growth has been a meaningful 40% during the last ten years.
The leading index for the European Union (15 countries) remained quite firm and rose 0.4% after a downwardly revised 0.3% March rise. That lifted the index's six month growth rate to 4.7%, the best since April 2004. During the last ten years there has been a 59% correlation between the change in the leading index and the quarterly change in the European Union GDP volume index.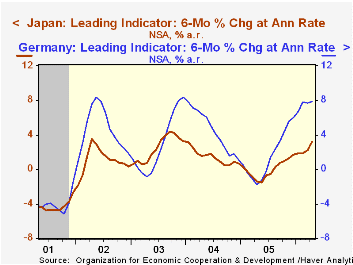
The German leading index improved 0.6% following a March gain that was revised down to 0.4%. As a result, the six month growth rate was 7.9% that was still the strongest rate of increase since December 2003. New orders remained firm and interest rate spreads were less negative. During the last ten years there has been a 32% correlation between the change in the German leading index and the quarterly change in GDP volume.
A leaders in France rose 0.2% in April for the third consecutive month. At a stable 3.9%, the series' six month growth rate is much improved versus the negative growth rates during the middle of last year. The future tendency of production improved despite still-languishing consumer confidence and depressed job vacancies.
The Italian leading index rose 0.4%, only the second monthly increase this year, and the series' six month growth rate rose to 1.1%. New orders rose sharply and consumer confidence improved.
The U.S. leaders fell 0.1% and reversed the slim 0.1% March up tick. The recent weakness lowered the six month growth in the leaders to 3.6% as consumer sentiment fell as did most other leading series except share prices. The correlation between the leaders' growth rate and real GDP growth has been a high 73% during the last ten years.
The UK leaders rose 0.2% after a 0.3% March gain that was half the initial reported rise. The six month growth rate at 1.7%, nevertheless, was the best in two years though consumer confidence fell to its lowest in three years.
The Canadian leaders fell 0.6% for the second consecutive month and were down for the third month this year. The weakness and the downwardly revised declines dropped the six month growth rate to -0.7%, the first negative reading since October. The correlation of the leaders' growth with Canadian real GDP has been 49% during the last ten years.
The latest OECD Leading Indicator report is available here.
| OECD | April | March | Y/Y | 2005 | 2004 | 2003 |
|---|---|---|---|---|---|---|
| Composite Leading Index | 105.42 | 105.22 | 3.4% | 102.85 | 102.38 | 97.99 |
| 6 Month Growth Rate | 3.5% | 3.6% | 0.7% | 3.5% | 2.6% |
by Louise Curley June 12, 2006
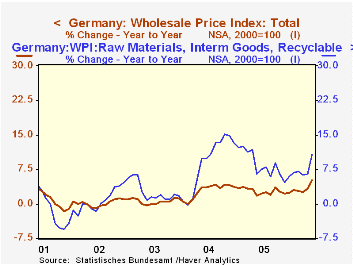
Wholesale prices in Germany rose 5% in May over a year ago. This was the largest year-over-year increase since the 6.05% recorded in November, 2000. Moreover, most of the prices in the underlying components of the index are now showing signs of accelerating.
The increases in wholesale prices in Germany have, in recent years, been dominated by movements in the Raw Materials, Intermediate Goods and Recyclables category where the price of oil is recorded. The first chart shows the year-to-year percent changes in the Wholesale Price Index and the sub index of prices of Raw Materials, Intermediate Goods and Recyclables. Although the year-to-year increases in these latter prices had, in recent months, shown some signs of declining from the 13-15% increases of reached in late 2005, they have now reversed trend and rose almost 11% in May.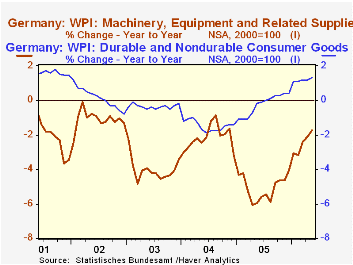
While the increases in the prices of Agricultural Products and Animals in late 2003 and into 2004 reinforced the impact of rising oil prices, the subsequent declines in these prices helped to mitigate the effect of the continued rise in oil prices. But now, these prices are once more beginning to rise and in May were 7.13% above May, 2005.
The deflationary tendencies in the prices for Consumer Goods began to lessen in late 2004 and, in the case of Machinery and Equipment, in mid 2005, as can be seen the second chart. Prices of consumer goods have been showing positive increases over year ago figures since August, 2005 and in May were up 1.3% over a year ago. Prices of machinery and Equipment are still declining, but in May the decline was only 1.73 % below a year ago compared with a year-to-year decline of 6.05% in April, 2005.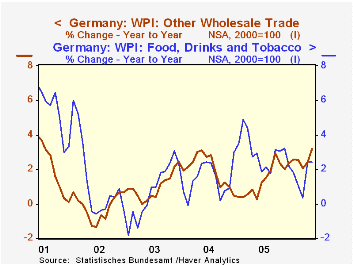
The prices of the Food, Drink and Tobacco have risen in April and May after a sharp fall in March. These prices are now rising at 2.4% a year. The prices of the Other Wholesale Trade component rose 3.2% over a year ago from 2.4% in April. These prices are shown in the third chart.
| Germany Wholesale Price Indexes (2000=1000 | May 06 | Apr 06 | May 05 | M/M % | Y/Y % | 2005 % | 2004 % | 2003 % |
|---|---|---|---|---|---|---|---|---|
| Wholesale Prices Total | 112.6 | 111.8 | 107.2 | 0.72 | 5.04 | 2.74 | 2.80 | 0.57 |
| Agricultural Products and Animals | 103.7 | 104.1 | 96.8 | -0.38 | 7.13 | -4.97 | -3.75 | 1.40 |
| Food, Drink and Tobacco | 114.9 | 114.8 | 112.2 | 0.09 | 2.41 | 2.98 | 1.41 | 0.74 |
| Consumer Goods, Durable and Nondurable | 100.7 | 100.5 | 99.4 | 0.20 | 1.31 | -0.23 | -1.47 | -0.35 |
| Raw Materials, Intermediate Goods and Recyclables | 132.6 | 130.5 | 119.7 | 1.61 | 10.78 | 8.35 | 8.89 | 2.67 |
| Machinery and Equipment | 85.1 | 85.1 | 86.6 | 0.00 | -1.73 | -5.07 | -2.17 | -4.01 |
| Other Wholesale Trade | 109.7 | 109.5 | 106.3 | 0.14 | 3.20 | 1.40 | 1.96 | 0.99 |
Tom Moeller
AuthorMore in Author Profile »Prior to joining Haver Analytics in 2000, Mr. Moeller worked as the Economist at Chancellor Capital Management from 1985 to 1999. There, he developed comprehensive economic forecasts and interpreted economic data for equity and fixed income portfolio managers. Also at Chancellor, Mr. Moeller worked as an equity analyst and was responsible for researching and rating companies in the economically sensitive automobile and housing industries for investment in Chancellor’s equity portfolio. Prior to joining Chancellor, Mr. Moeller was an Economist at Citibank from 1979 to 1984. He also analyzed pricing behavior in the metals industry for the Council on Wage and Price Stability in Washington, D.C. In 1999, Mr. Moeller received the award for most accurate forecast from the Forecasters' Club of New York. From 1990 to 1992 he was President of the New York Association for Business Economists. Mr. Moeller earned an M.B.A. in Finance from Fordham University, where he graduated in 1987. He holds a Bachelor of Arts in Economics from George Washington University.


