 Global| Jan 15 2007
OECD Leaders Rose
by:Tom Moeller
|in:Economy in Brief
Summary
The Leading Index of the major 7 OECD economies rose 0.2% after a like gain during October but earlier month's increases were revised lower. The index's six month growth rate dropped to 1.1% from 1.6% as a result of the revisions. [...]
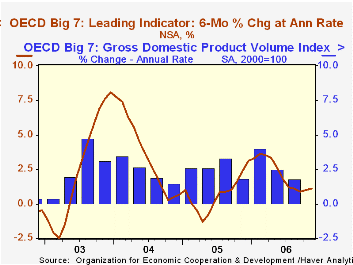
The Leading Index of the major 7 OECD economies rose 0.2% after a like gain during October but earlier month's increases were revised lower. The index's six month growth rate dropped to 1.1% from 1.6% as a result of the revisions.
During the last ten years there has been a 64% correlation between the change in the leading index and the q/q change in the GDP Volume Index for the Big Seven OECD countries.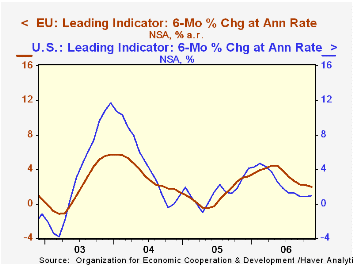
The U.S. leading indicators increased 0.2% for the second month but September's gain was revised down sharply to a slight decline. The index's six month growth rate as a result was halved to 1.0%, down from growth rates above 4% at the beginning of 2006. The correlation between the leaders' growth rate and U.S. real GDP growth has been a high 73% during the last ten years.
The leading index for the European Union (15 countries) rose 0.1% for the third month in the last four. The modest gains dropped the index's six month growth rate to 2.0%, half the growth of earlier in the year. During the last ten years there has been a 59% correlation between the change in the leading index and the quarterly change in the European Union GDP volume index.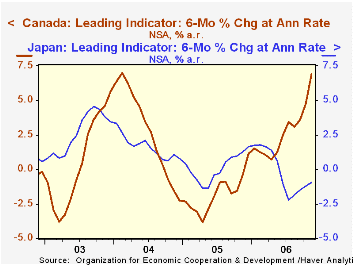
The German leading index rose a firm 0.5% increase in November but the 0.5% increase first reported for October was revised to 0.2%. That pulled the leaders' growth to 3.5%, less than half its earlier growth. During the last ten years there has been a 32% correlation between the change in the German leading index and the quarterly change in GDP volume.
The Italian leading index fell for the fourth month in the last five and lowered the series' six month growth rate to -2.1%.
A French leaders also dipped 0.1% but six month growth in leaders held steady at a moderate 2.3%. During the last ten years there has been a 54% correlation between the leaders' growth rate and growth in France's real GDP.
The leading index in Japan rose 0.1% for the third consecutive month. Nevertheless the index's six month growth rate remained negative at -0.9%. The leaders' correlation with Japan's real economic growth has been a meaningful 41% during the last ten years.
The Canadian leaders surged 1.5% after October's 0.9% jump. The leaders' six month growth rate consequently surged to 6.9%, its best since 2002, due to higher share prices in Toronto. The correlation of the leaders' growth with Canadian real GDP has been 49% during the last ten years.
The UK leaders rose a modest 0.2% for the second month and the six month growth rate increased to a low 1.4%. During the last ten years there has been a 36% correlation between the leaders' growth rate and U.K. real GDP growth.
The latest OECD Leading Indicator report can be found here.
OECD Warns Climate Change Is Threatening Europe's Skiing Trade is available here.
| OECD | November | October | Y/Y | 2005 | 2004 | 2003 |
|---|---|---|---|---|---|---|
| Composite Leading Index | 105.45 | 105.23 | 1.5% | 102.79 | 102.30 | 97.80 |
| 6 Month Growth Rate | 1.1% | 1.0% | -- | 0.7% | 3.5% | 2.6% |
by Louise Curley January 15, 2007
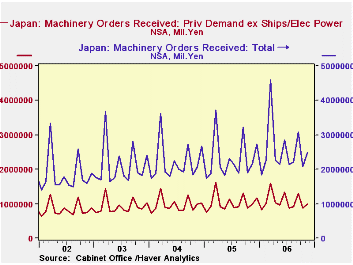
The Economic and Social Research Institute (ESRI) of the Cabinet Office in Japan announced today that new orders for machinery were well above expectations. On a seasonally unadjusted basis new orders were 19.3% above November, 2005 and on a seasonally adjusted basis were 14.22% above October.
Orders are reported in total in the month they are received even if they are very large and will not be completed for several months; as a result, the series tends to be extremely volatile. ESRI publishes a "Headline" series which excludes two of the most erratic components--ships and electric power. The seasonally unadjusted series for total orders and the seasonally unadjusted Headline Series are shown in the first chart. On a seasonally unadjusted basis the Headline series was 0.7% above November, 2005 and the seasonally adjusted series was 3.8% above October.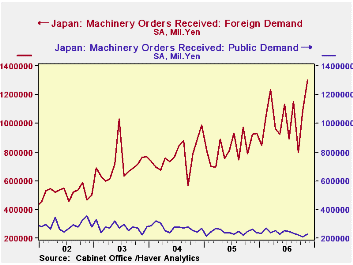
With data through November, we have a good idea of how the current year is fairing vis-à-vis 2005. Total orders for the period January through November, 2006 were 27,963.3 billion yen or 12.6% above the 24,841.8 billion yen in the comparable period in 2005. This represents a substantial increase over the 4.35% increase in 2005 over 2004. The Headline Series shows a different picture. The eleven month total of Headline orders was 11,721.5 billion yen in the current year or only 4.77% above the 11.188.1 billion yen recorded in the January to November period of 2005. Moreover, the indicated increase for 2006 is well below the actual increase of 7.11% in 2005. It would appear that ships and electric power have provided much of the growth in total orders this year. However, the difference between total new orders and the Headline series includes foreign and government orders as well as ships and electric power.
In the second chart showing seasonally adjusted foreign and government orders, it is clear that foreign orders have been an important part of the growth in total orders while government orders have played a slightly negative role.
| JAPAN NEW ORDERS (Bil Yen, ex where noted) |
Nov06 | Oct 06 | Sep 06 | J-N 06 | J-N 05 | J-N 06/ J-N 05% |
2005 % | 2004 % | 2003 % |
|---|---|---|---|---|---|---|---|---|---|
| Total New Orders NAS | 2,482.7 | 2,081.5 | 3,069.2 | 27,963.3 | 24,841.8 | 12.6 | 4.35 | 4.24 | 15.05 |
| Y/Y percent change | 19.27 | -32.18 | 39.20 | -- | -- | -- | -- | -- | -- |
| Total New Orders SA | 2,804.6 | 2,455.6 | 2,319.4 | -- | -- | -- | -- | -- | -- |
| M/M percent change | 14.22 | 5.87 | -12.95 | -- | -- | -- | -- | -- | -- |
| Headline Series NAS | 994.7 | 861.5 | 1,305.3 | 11,721.5 | 11,188.1 | 4.77 | 7.11 | 4.43 | 10.68 |
| Y/Y percent change | 0.70 | -1.18 | -14.7 | -- | -- | -- | -- | -- | -- |
| Headline Series SA | 1,064.2 | 1,025.4 | 997.5 | -- | -- | -- | -- | -- | -- |
| M/M percent change | 3.78 | 2.80 | -7.26 | -- | -- | -- | -- | -- | -- |
| Foreign New Orders | 1,302.5 | 1,088.4 | 795.8 | 11,382.1 | 9024.7 | 26.23 | 6.85 | 9.43 | 37.08 |
| Public New Orders | 229.5 | 209.0 | 223.4 | 2,625.2 | 2,674.9 | -1.82 | 9.80 | -6.44 | -5.13 |

Tom Moeller
AuthorMore in Author Profile »Prior to joining Haver Analytics in 2000, Mr. Moeller worked as the Economist at Chancellor Capital Management from 1985 to 1999. There, he developed comprehensive economic forecasts and interpreted economic data for equity and fixed income portfolio managers. Also at Chancellor, Mr. Moeller worked as an equity analyst and was responsible for researching and rating companies in the economically sensitive automobile and housing industries for investment in Chancellor’s equity portfolio. Prior to joining Chancellor, Mr. Moeller was an Economist at Citibank from 1979 to 1984. He also analyzed pricing behavior in the metals industry for the Council on Wage and Price Stability in Washington, D.C. In 1999, Mr. Moeller received the award for most accurate forecast from the Forecasters' Club of New York. From 1990 to 1992 he was President of the New York Association for Business Economists. Mr. Moeller earned an M.B.A. in Finance from Fordham University, where he graduated in 1987. He holds a Bachelor of Arts in Economics from George Washington University.
More Economy in Brief


