 Global| May 12 2005
OECD Leaders Lost More Forward Momentum
by:Tom Moeller
|in:Economy in Brief
Summary
The Leading Index of the Major 7 OECD economies fell for the second month. The 0.6% decline in March followed a downwardly revised 0.5% drop in February and pulled the index's six month growth rate negative. During the last ten years [...]
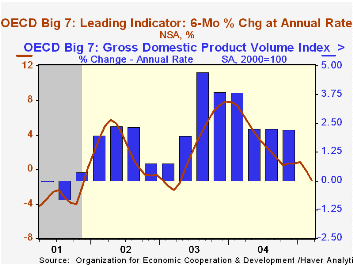
The Leading Index of the Major 7 OECD economies fell for the second month. The 0.6% decline in March followed a downwardly revised 0.5% drop in February and pulled the index's six month growth rate negative.
During the last ten years there has been a 69% correlation between the change in the leading index and the q/q change in the GDP Volume Index for the Big Seven countries in the OECD.
The leaders for the European Union (15 countries) declined for the fourth straight month and the six month growth rate of 0.1% was down from roughly 6% a year ago. The German leaders fell for the fifth month in the last six due to weaker new orders, a negative yield curve and a worsening business climate. The six month growth rate fell to a -1.7%. The French leaders fell for the fifth consecutive month and the six month growth went negative for the first time since May 2003 as new job vacancies remained depressed, share prices meandered and industrial sector prospects deteriorated. The Italian leaders dipped for the forth month in five. The six month growth rate of -0.6% remained negative as it has since last May due to a lower future tendency of orders books and of production.
The leading index for the US economy fell a hard 1.0% and six month growth went negative for the first time since April 2003. A negative yield curve and a deteriorating business climate indicator caused the decline. The leaders for Japan fell for the fourth straight month and six month growth was a negative 0.7% due to a tighter yield curve and fewer overtime hours worked.
The UK economic leaders slipped for the fifth consecutive month with six month growth solidly negative at -1.2% due to higher interest rates and weaker export prospects.The Canadian leaders have trended lower for a year and six month growth of -3.5% was the worst in two years. The yield curve is sharply inverted and housing starts are down.
The latest OECD Leading Indicator report can be found here.
| OECD | March | Feb | Y/Y | 2004 | 2003 | 2002 |
|---|---|---|---|---|---|---|
| Composite Leading Index | 101.37 | 102.00 | -0.6% | 101.99 | 97.51 | 96.33 |
| 6 Month Growth Rate | -1.3% | -0.1% | 3.6% | 2.5% | 2.3% |

Tom Moeller
AuthorMore in Author Profile »Prior to joining Haver Analytics in 2000, Mr. Moeller worked as the Economist at Chancellor Capital Management from 1985 to 1999. There, he developed comprehensive economic forecasts and interpreted economic data for equity and fixed income portfolio managers. Also at Chancellor, Mr. Moeller worked as an equity analyst and was responsible for researching and rating companies in the economically sensitive automobile and housing industries for investment in Chancellor’s equity portfolio. Prior to joining Chancellor, Mr. Moeller was an Economist at Citibank from 1979 to 1984. He also analyzed pricing behavior in the metals industry for the Council on Wage and Price Stability in Washington, D.C. In 1999, Mr. Moeller received the award for most accurate forecast from the Forecasters' Club of New York. From 1990 to 1992 he was President of the New York Association for Business Economists. Mr. Moeller earned an M.B.A. in Finance from Fordham University, where he graduated in 1987. He holds a Bachelor of Arts in Economics from George Washington University.
More Economy in Brief


