 Global| Apr 10 2006
OECD Leaders Improved
by:Tom Moeller
|in:Economy in Brief
Summary
The Leading Index of the Major 7 OECD economies rose 0.4% during February following upwardly revised increases in January and December. The gains lifted the leaders' six month growth rate to 3.8%, its best in nearly two years. During [...]
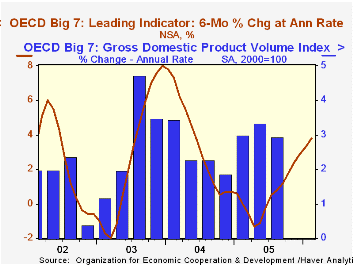
The Leading Index of the Major 7 OECD economies rose 0.4% during February following upwardly revised increases in January and December. The gains lifted the leaders' six month growth rate to 3.8%, its best in nearly two years.
During the last ten years there has been a 64% correlation between the change in the leading index and the q/q change in the GDP Volume Index for the Big Seven OECD countries.
During February, the U.S. leaders increased 0.5% after a 0.5% January increase which was revised up from the slight decline reported initially. The leaders' six month growth rose to 4.7%. Higher share prices, consumer sentiment and durable goods orders have contributed to the rise. The correlation between the leaders' growth rate and real GDP growth has been a high 73% during the last ten years.
Leaders in the European Union (15 countries) rose 0.4% after an unrevised 0.4% January gain. As a result, six month growth in the index improved to 4.1%, the best since May 2004. During the last ten years there has been a 59% correlation between the change in the leading index and the quarterly change in the European Union GDP volume index.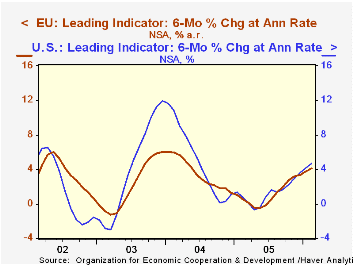
TheGerman leading index rose another strong 0.8% after a 0.7% jump during January and lifted the six month growth rate to 7.9%. The business climate indicator is improved and orders are up. During the last ten years there has been a 32% correlation between the change in the German leading index and the quarterly change in GDP volume.
A leaders in France increased 0.2%. The modest increase did, however, lift the series six month growth rate to 4.1% as the industrial sector's prospects improved as did the future tendency of production. New car registrations and job prospects remained depressed but the terms of trade were up.
The Italian leading index showed further improvement though the small 0.2% gain followed a downwardly revised 0.1% January decline. The series' six month growth rate turned positive at 0.5% for the first time since early 2004 as the future tendency of production and consumer confidence rose.
The UK leaders rose just 0.1% for the second month and the six month growth rate was positive (0.2%) for the second month in the last year. Consumer confidence, export prospects and new car registrations have been depressed though the FT Share Price index was at the highest level since 2001.
In Japan, the February leading index rose 0.1% but the 0.5% gain initially reported for January was revised to 0.1%. That pulled the index's six month growth rate to a still improved 2.0% due to higher share prices and more construction starts. The leaders' correlation with Japan's real economic growth has been a meaningful 40% during the last ten years.
The Canadian leaders surged 0.6% though the January increase was revised down sharply to 0.2%. The six month growth rate jumped to 3.0%, its most promising since Summer 2004. The correlation of the leaders' growth with Canadian real GDP has been 49% during the last ten years.
The latest OECD Leading Indicator report is available here.
| OECD | Feb | Jan | Y/Y | 2005 | 2004 | 2003 |
|---|---|---|---|---|---|---|
| Composite Leading Index | 105.00 | 104.60 | 2.5% | 102.75 | 102.40 | 97.87 |
| 6 Month Growth Rate | 3.8% | 3.3% | 0.6% | 3.6% | 2.8% |
by Louise Curley April 10, 2006
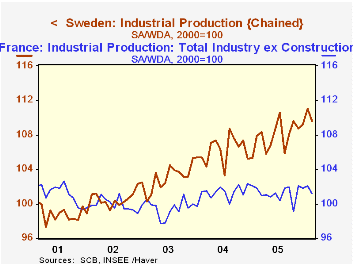
February industrial production data for Sweden, France, the Czech Republic and Slovenia were released today. In each case there was a decline from January in the seasonally adjusted data. Except for France, however, the February figures for each country were above February, 2005, indicating that the positive trends in industrial production in these countries were still in place.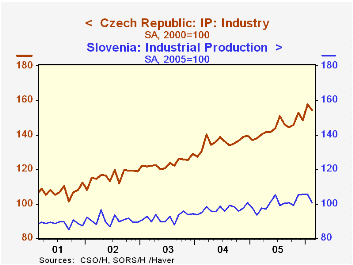
The first chart shows the indexes of industrial production for Sweden and France and the second, for the Czech Republic and Slovenia.(Industrial Production for Slovenia is published on the basis of 2005=100. To facilitate the comparison with the Czech Republic, we have made use of the index function in the list of advanced functions to rebase the Slovene data to 2000=100)
As shown in the first chart industrial production in Sweden has been stronger than in France. In fact, industrial production in France has shown little change over the past five years. In the east, there have also been variations in growth of industrial production as indicated in the second chart which shows industrial production in the Czech Republic rising considerably faster than in Slovenia. Industrial production in the eastern European countries has, however, generally increased faster than production in the western European countries over the past five years. In February, industrial production in the Czech Republic was 54% above the average of 2000, in Slovenia it was 17% above its 2000 average, in Sweden, 10% and in France, a mere 1%.
| Industrial Production (2000=100) | Feb 06 | Jan 06 | Feb 05 | M/M % | Y/Y % | 2005 | 2004 | 2003 |
|---|---|---|---|---|---|---|---|---|
| France | 101.2 | 102.1 | 101.8 | -0.88 | -0.59 | 101.3 | 101.3 | 99.5 |
| Sweden | 109.6 | 111.1 | 107.9 | -1.35 | 1.58 | 107.9 | 106.2 | 102.9 |
| Czech Republic | 154.3 | 157.8 | 138.0 | -2.22 | 11.81 | 144.1 | 135.6 | 123.4 |
| Slovenia | 116.9 | 122.9 | 108.4 | -4.82 | 7.82 | 116.3 | 112.7 | 106.9 |
| Addendum: | ||||||||
| Slovenia (2005=100) | 100.6 | 105.7 | 93.3 | -4.82 | 7.82 | 100.0 | 97.0 | 91.9 |

Tom Moeller
AuthorMore in Author Profile »Prior to joining Haver Analytics in 2000, Mr. Moeller worked as the Economist at Chancellor Capital Management from 1985 to 1999. There, he developed comprehensive economic forecasts and interpreted economic data for equity and fixed income portfolio managers. Also at Chancellor, Mr. Moeller worked as an equity analyst and was responsible for researching and rating companies in the economically sensitive automobile and housing industries for investment in Chancellor’s equity portfolio. Prior to joining Chancellor, Mr. Moeller was an Economist at Citibank from 1979 to 1984. He also analyzed pricing behavior in the metals industry for the Council on Wage and Price Stability in Washington, D.C. In 1999, Mr. Moeller received the award for most accurate forecast from the Forecasters' Club of New York. From 1990 to 1992 he was President of the New York Association for Business Economists. Mr. Moeller earned an M.B.A. in Finance from Fordham University, where he graduated in 1987. He holds a Bachelor of Arts in Economics from George Washington University.


