 Global| Sep 10 2003
OECD Leaders Build Upward Momentum
by:Tom Moeller
|in:Economy in Brief
Summary
The OECD Index of Leading Indicators (Big 7) rose in July for the fourth consecutive month, but it was the magnitude of the increase that impressed. The 1.1% July gain followed like increases in the previous three months. The three [...]
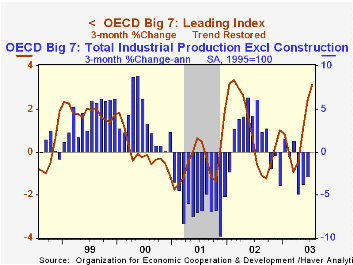
The OECD Index of Leading Indicators (Big 7) rose in July for the fourth consecutive month, but it was the magnitude of the increase that impressed. The 1.1% July gain followed like increases in the previous three months.
The three month growth in the leading index is comparable to strength early last year which preceded an acceleration in industrial production growth to above 5% (AR).
Gains amongst the member country leading indexes continued to broaden out. The leading index for the Euro-zone 12 rose 0.3% and the three month growth rate rose to 4.9% (AR), it's highest since last Spring.
The leaders in Germany surged 1.2%, bringing the three month growth rate up to 9.3%. In France the leaders rose for the fourth consecutive month with three month growth at 6.5%. In Italy, however, the leaders continued to suggest recession, down 1.4% in July for the third decline in the last four months. Real GDP in Italy fell at a 1.5% rate in 1Q03 and was unchanged last quarter. Industrial production has been falling since a peak in late 2000.
In the U.K. the leaders rose strongly for the fourth consecutive month and that brought the three month growth to 6.9% (AR). Last year, growth of this order in the UK leaders preceded an acceleration in real GDP growth from about 1% to nearly 4%. In Canada the July leading indicators were similarly strong rising 1.0%, the fourth consecutive gain that pulled the three month growth rate up to 12.1%; good news following a 0.3% decline in 2Q03 real GDP.
Leaders in Japan jumped 2.0% in July for the third strong gain in as many months. Share prices rose and the yield curve steepened, but higher overtime hours & an increase in job vacancies added tangible umph to the leader's improvement.
Leading indicators in the United States surged further, up 1.2% in July for the fourth consecutive robust monthly gain.
Visit the OECD's website at website. There is coverage of Chief Economist Cotis' presentation titled "What is the economic outlook for OECD countries? An interim assessment."
| OECD Main Economic Indicators | July | June | Y/Y | 2002 | 2001 | 2000 |
|---|---|---|---|---|---|---|
| OECD Major Seven - Leading Index (Trend Restored) | 121.7 | 120.3 | 3.0% | 4.0% | -2.2% | 3.1% |
| European Union | 118.0 | 117.6 | 1.1% | 3.1% | -1.8% | 3.8% |
| Japan | 104.9 | 102.8 | 3.6% | 0.7% | -2.9% | 2.5% |
| United States | 134.1 | 132.4 | 4.3% | 5.6% | -2.6% | 2.7% |
by Tom Moeller September 10, 2003
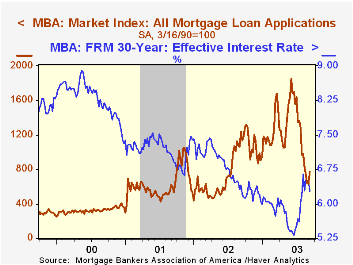
The index of mortgage applications compiled by the Mortgage Bankers Association jumped 22.8% last week as interest rates fell. The rise was the first in five weeks.
Interest rates on a conventional 30-Year mortgage fell 23 basis points with the effective rate at 6.27%. That was versus a low for 30-Year financing of 5.31% in the second week of June. The effective rate on a 15-year mortgage fell 25 basis points to 5.64%.
Applications to refinance surged 45.5% w/w, pulling the level of refinancing to it's highest in four weeks.
Purchase applications, up 3.2% w/w, rose for the second consecutive week. The level of purchase applications began September slightly ahead of the August average which was down 6.3% from July, the series' peak.
During the last ten years there has been a 56% correlation between the y/y change in purchase applications and the change in new plus existing home sales.
The Mortgage Bankers Association surveys between 20 to 35 of the top lenders in the U.S. housing industry to derive its refinance, purchase and market indexes. The weekly survey accounts for more than 40% of all applications processed each week by mortgage lenders.
Visit the Mortgage Bankers Association site here .
| MBA Mortgage Applications (3/16/90=100) | 9/05/03 | 8/29/03 | 2002 | 2001 | 2000 |
|---|---|---|---|---|---|
| Total Market Index | 771.8 | 628.7 | 799.7 | 625.6 | 322.7 |
| Purchase | 408.8 | 396.1 | 354.7 | 304.9 | 302.7 |
| Refinancing | 2,883.6 | 1,981.5 | 3,388.0 | 2,491.0 | 438.8 |

Tom Moeller
AuthorMore in Author Profile »Prior to joining Haver Analytics in 2000, Mr. Moeller worked as the Economist at Chancellor Capital Management from 1985 to 1999. There, he developed comprehensive economic forecasts and interpreted economic data for equity and fixed income portfolio managers. Also at Chancellor, Mr. Moeller worked as an equity analyst and was responsible for researching and rating companies in the economically sensitive automobile and housing industries for investment in Chancellor’s equity portfolio. Prior to joining Chancellor, Mr. Moeller was an Economist at Citibank from 1979 to 1984. He also analyzed pricing behavior in the metals industry for the Council on Wage and Price Stability in Washington, D.C. In 1999, Mr. Moeller received the award for most accurate forecast from the Forecasters' Club of New York. From 1990 to 1992 he was President of the New York Association for Business Economists. Mr. Moeller earned an M.B.A. in Finance from Fordham University, where he graduated in 1987. He holds a Bachelor of Arts in Economics from George Washington University.
More Economy in Brief


