 Global| Oct 04 2002
Nonfarm Payrolls Fell in September
by:Tom Moeller
|in:Economy in Brief
Summary
Nonfarm payrolls fell unexpectedly last month, down 43,000. It was the first decline in payrolls since April. August's moderate payroll gain was revised up sharply to 107,000 from 39,000 reported last month. Payrolls are about [...]
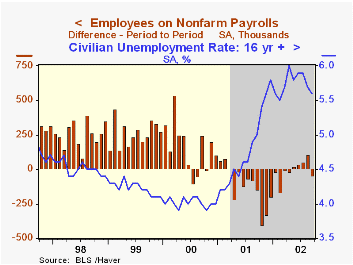
Nonfarm payrolls fell unexpectedly last month, down 43,000. It was the first decline in payrolls since April. August's moderate payroll gain was revised up sharply to 107,000 from 39,000 reported last month. Payrolls are about unchanged YTD.
The length of the workweek rose for the second month, but only back to the June level. As a result, the index of aggregate hours worked (employment times hours worked) rose 0.4% following a 0.3% August gain. The average for 3Q was 0.2% below the 2Q average. That followed no change in 2Q.
Amongst industries, factory sector jobs fell 0.2%, continuing a decline that began in early 1998. The one-month diffusion index rose slightly to a still-depressed 40.4, heralding continued decline in factory jobs. Construction jobs fell 1,000, the second decline in three months. Jobs in service producing industries declined 5,000, the first decline since February. Declines were widespread in the retail, wholesale and transportation industries. Government employment rose 4,000.
The one-month diffusion index for nonfarm payrolls improved slightly to 47.7. The level suggests little or no employment growth near term. The three month diffusion index was 45.0.
The gain in average hourly earnings was as expected and pulled the y/y gain to its lowest since early 1996.
The unemployment rate fell unexpectedly as a result of a huge 711,000 (0.8% YTD) rise in employment and only a 661,000 (0.7% YTD) rise in the labor force.
The nonfarm payroll employment figures are based on reports provided to the US Labor Department by businesses, while the figures from which the unemployment rate is derived are based on a survey of US households.
| Employment | Sept | Aug | Y/Y | 2001 | 2000 | 1999 |
|---|---|---|---|---|---|---|
| Payroll Employment | -43,000 | 107,000 | -0.7% | 0.2% | 2.2% | 2.4% |
| Manufacturing | -35,000 | -63,000 | -4.5% | -4.2% | -0.4% | -1.3% |
| Average Weekly Hours | 34.3 | 34.1 | 34.1 | 34.2 | 34.4 | 34.5 |
| Average Hourly Earnings | 0.3% | 0.3% | 3.0% | 4.1% | 3.9% | 3.6% |
| Unemployment Rate | 5.6% | 5.7% | 5.0% | 4.8% | 4.0% | 4.2% |

Tom Moeller
AuthorMore in Author Profile »Prior to joining Haver Analytics in 2000, Mr. Moeller worked as the Economist at Chancellor Capital Management from 1985 to 1999. There, he developed comprehensive economic forecasts and interpreted economic data for equity and fixed income portfolio managers. Also at Chancellor, Mr. Moeller worked as an equity analyst and was responsible for researching and rating companies in the economically sensitive automobile and housing industries for investment in Chancellor’s equity portfolio. Prior to joining Chancellor, Mr. Moeller was an Economist at Citibank from 1979 to 1984. He also analyzed pricing behavior in the metals industry for the Council on Wage and Price Stability in Washington, D.C. In 1999, Mr. Moeller received the award for most accurate forecast from the Forecasters' Club of New York. From 1990 to 1992 he was President of the New York Association for Business Economists. Mr. Moeller earned an M.B.A. in Finance from Fordham University, where he graduated in 1987. He holds a Bachelor of Arts in Economics from George Washington University.
More Economy in Brief


