Global| Jun 12 2007
NFIB - Small Bounce but Still in Downtrend
Summary
The NFIB index is depicted in the chart as being in the grip of a downtrend with a minor uptrend that remains trapped in a bear channel. It is still not close to breaking out of that channel on the upside but it is headed in that [...]
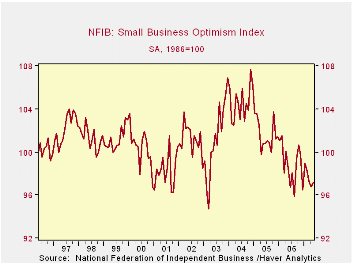
The NFIB index is depicted in the chart as being in the grip of a downtrend with a minor uptrend that remains trapped in a bear channel. It is still not close to breaking out of that channel on the upside but it is headed in that direction. At this point it is all speculation as to whether it will make it or not.
The responses to the broader NFIB survey are in the table below. They are for the most part still on the weak side as you would expect with an overall index that looks as this one does. Still, evidence on the overall US economy shows that conditions are getting better. So this improved performance could filter down and lift small business as well. But it could also be that weakness in small business is ‘the termites in the woodwork’ that will bring the big business strength down. Since much of hiring is in small businesses, the recent strength in jobs is encouraging even if not well reflected in the survey. For the moment it is a tug of war. These NFIB signals of course draw from this period of elevated energy prices and all firms are feeling that pinch. The revival of jobs growth after a period of persisting bad weather through the first four months of the year (as evidenced by work disruptions reported in the monthly jobs report) have now been set aside. In some sense we begin the process of assessing growth anew now with energy prices having moved up and the Fed no longer on a preconceived policy path and without a clear policy bias despite its stated relatively greater fear of inflation rising.
The NFIB survey shows rebounds in trends from March onward. Still the absolute readings are poor and are very low by historic standards; the response for " the economy is expected to improve" is in the bottom 11 percentile of its range since 2001. The one clear element lacking is that farms are unwilling to increase inventories. Capital spending plans are a touch weaker than they have been but still reside at a strong point relative to history (in the 90-plus percentile). Firms report fairly steady and moderate selling prices obtained and worker compensation costs paid. While firms are not planning to increase inventories, they report that inventories are rising. They report that credit has become relatively harder to get. Those reporting higher sales Q/Q are fewer in number but the number of positive responses is still historically at or above average depending on the period.
| NFIB | % of range | |||||
| May-07 | Apr-07 | Mar-07 | May-06 | since 2001* | since 1990* | |
| INDEX | 97.2 | 96.8 | 97.3 | 98.2 | 19.2% | 35.6% |
| % saying…… | ||||||
| Firms Expecting | ||||||
| Credit conditions to ease | -6.0 | -7.0 | -8.0 | -8.0 | 42.9% | 53.8% |
| Economy to Improve | -3.0 | -8.0 | -7.0 | -2.0 | 11.5% | 28.0% |
| Higher Real Sales 6-Mo | 16.0 | 14.0 | 14.0 | 17.0 | 47.6% | 47.6% |
| Firms Reporting | ||||||
| Higher Earnings | -15.0 | -19.0 | -15.0 | -19.0 | 60.7% | 60.7% |
| Inventories 'too low' | -6.0 | -3.0 | -5.0 | -2.0 | 10.0% | 9.1% |
| Good Time to Expand | 12.0 | 12.0 | 12.0 | 18.0 | 22.7% | 26.1% |
| Firms Planning | ||||||
| To Increase Employment | 13.0 | 13.0 | 12.0 | 13.0 | 63.2% | 57.1% |
| To Add Inventories | 0.0 | 3.0 | 3.0 | 3.0 | 7.7% | 20.0% |
| Capital expenditures 3-6 mos | 29.0 | 29.0 | 33.0 | 30.0 | 30.8% | 25.0% |
| Inflation Issues | ||||||
| Firms Raising | ||||||
| Avg Selling Price | 26.0 | 18.0 | 15.0 | 13.0 | 91.7% | 91.7% |
| Worker Compensation | 29.0 | 26.0 | 28.0 | 30.0 | 93.3% | 77.3% |
| Firms Plan to Raise | ||||||
| Avg Selling Price | 23.0 | 24.0 | 22.0 | 23.0 | 54.5% | 54.5% |
| Worker Compensation | 38.0 | 37.0 | 35.0 | 39.0 | 52.9% | 52.9% |
| Other | ||||||
| Firms Reporting | ||||||
| Higher sales Q/Q | 1.0 | 4.0 | 0.0 | -1.0 | 60.6% | 50.0% |
| Credit Harder to Get | 6.0 | 5.0 | 7.0 | 5.0 | 75.0% | 46.2% |
| Raising Inventories | 2.0 | -2.0 | 2.0 | 5.0 | 70.6% | 40.9% |
| *100% is high, 0% is low | ||||||
by Robert Brusca June 12, 2007
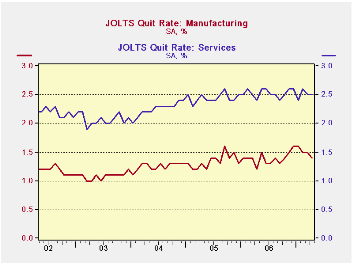
The JOLTS report quit rate is the most important reading of this varied report that has regional and industry detail as well as national readings. When people are wiling to QUIT the jobs they have it is the best sign of strength in the underlying labor market. This month the private quit rate remained steady at 2.2% while the quit rate in services industries remained high (79.8 percentile of its range) and the MFG sector saw quits drop to 1.4% from 1.5% in what has been a sector with weakening labor demands. The quit rate rose – surprisingly in construction but the seasonal construction work is beginning to pick up at this time of year. And the government quit rate, while a scant 0.7%, is as high as it has ever been – government workers simply don’t quit; many have the job for its job security and pension.
Sector Detail – complied from report details (see table)-- Services and Government showed a high quit rate in April and, while the construction sector’s quit rate rose in the month, it was still in the bottom 20Th percentile of its range. Hires were very strong for government - at the top of its range. This reading squares with recent reports that tell us that many states have seen revenues rise above their expectations. Hires are also firm in services: approximately in the top third of its range. The job openings readings are strong in their respective ranges across industries, save construction, but that reading is not matched by strength in hires everywhere. Either this is an example of worker skill shortages or job openings statistics are vague and substantially meaningless. Separations are in the top two-thirds of their range for services and MFG and they are stronger still in Government. They remain low in construction. In MFG it is probably early retirements at work or negotiated attrition since layoffs per se were not up on the month.
On balance, the JOLTS report confirms the positive trends we have seen in MFG, Services and the weakness in construction. The Government sector appears to have become a stronger source of job creation and employee retention. The private quit rate is stable and strong and is well underpinned by the service sector. Weakness in MFG jobs does not seem a threat to overall labor market strength. On balance, the detail of this report is encouraging about the economy.
| As of…… | Major Job Sectors | |||
| Apr-07 | Services | MFG | Construction | Gov't |
| Job Openings | 76.2% | 84.6% | 57.1% | 87.5% |
| Hires | 65.1% | 42.9% | 13.3% | 100.0% |
| Separations | 62.9% | 66.7% | 29.2% | 75.0% |
| Quits | 79.8% | 66.7% | 16.7% | 100.0% |
| Raw readings by Industry | ||||
| OPENINGS | Services | MFG | Construction | Gov't |
| Apr-07 | 2.5 | 2.3 | 2.0 | 2.1 |
| Mar-07 | 2.3 | 2.2 | 1.9 | 2.1 |
| Feb-07 | 2.6 | 2.3 | 2.9 | 2.1 |
| Jan-07 | 2.6 | 2.3 | 1.8 | 2.1 |
| Hires | Services | MFG | Construction | Gov't |
| Apr-07 | 4.4 | 2.5 | 4.3 | 1.9 |
| Mar-07 | 4.3 | 2.3 | 4.6 | 1.8 |
| Feb-07 | 4.5 | 2.6 | 3.9 | 1.7 |
| Jan-07 | 4.5 | 2.6 | 3.9 | 1.7 |
| SEPARATIONS | Services | MFG | Construction | Gov't |
| Apr-07 | 4.0 | 2.8 | 4.9 | 1.4 |
| Mar-07 | 4.1 | 2.8 | 4.5 | 1.4 |
| Feb-07 | 4.0 | 3.0 | 4.2 | 1.3 |
| Jan-07 | 4.0 | 2.8 | 5.2 | 1.4 |
| QUITS | Services | MFG | Construction | Gov't |
| Apr-07 | 2.5 | 1.4 | 1.8 | 0.7 |
| Mar-07 | 2.5 | 1.5 | 1.7 | 0.7 |
| Feb-07 | 2.6 | 1.5 | 1.6 | 0.6 |
| Since 2000 | ||||
by Louise Curley June 12, 2007
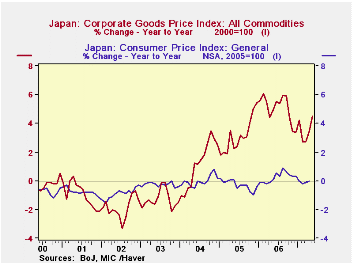
The Japanese Corporate Goods Prices Index (CGPI), a measure of producers' prices, rose 4.5% in May from May, 2006. This was the 37th month of year to year increases in this index. So far this rise has had little effect on the Consumer Price Index (CPI). From May, 2004 when the CGPI began its year over year rises until April* of this year, the index has risen by almost 11%. In contrast, the changes in the CPI have ranged between plus and minus 1% and have resulted in a decline of 0.1% over the whole period. The year to year changes in the CGPI and the CPI are shown in the first chart.
Import prices have been the chief culprit in the rise of the CGPI as can be seen in the second chart that shows the indexes for the total index and the domestic, export and import goods components.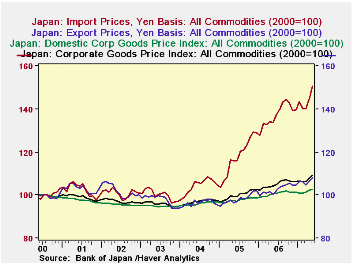
The prices of imported Metals and related products, Wood, lumber and related products and Petroleum, coal and natural gas have largely accounted for the increases in the import component of the index as can be seen in the third chart. The year over year change in the price of Petroleum, coal, and natural gas has actually shown some declines this year. But these declines have been offset by big year over year increases in the prices of Wood, lumber and related products and Metals and related products as can be seen in the third chart and in the table below.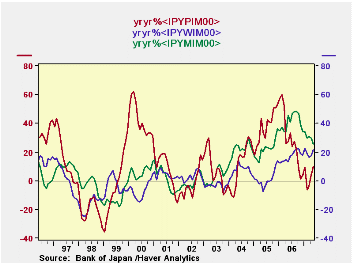
When and to what extent the producer prices will be reflected in the consumer price index is largely up to the consumer. The 0.76% increase in the private household consumption was encouraging. But consumers are still cautious. The Survey of Consumer Confidence showed a small decline in the diffusion index to 47.3% in May from 47.4% in April. A value of the index below 50% indicates that the pessimists outweigh the optimists. However, over the course of the history of survey, the optimists rarely prevailed, as can be seen in the fourth chart. The current level of 47.3% is among the highest values recorded. This suggests that the consumer may be less pessimistic than the a literal interpretation of the data would warrant.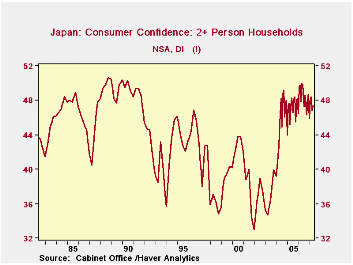 *We have used April as the final month since CPI data are not available for May.
| JAPAN CGPI AND CPI | May 07 | Apr 07 | Mar 07 | Feb 07 | Jan 07 | 2006 | 2005 | 2004 |
|---|---|---|---|---|---|---|---|---|
| Y/Y % | Y/Y % | Y/Y % | Y/Y % | Y/Y % | AVG | AVG | AVG | |
| CPI (2005=1000 | 1.00 | -0.10 | -0.20 | 0.00 | 100.3 | 100. | 100.3 | |
| CGPI (2000=100) | 4.51 | 3.46 | 2.71 | 2.71 | 4.20 | 105.1 | 100.1 | 97.1 |
| Domestic Prices | 2.19 | 2.30 | 2.01 | 1.71 | 2.12 | 100.7 | 97.7 | 96.1 |
| Export Prices | 7.85 | 4.62 | 3.56 | 4.53 | 6.21 | 102.8 | 98.3 | 96.4 |
| Import Prices | 12.48 | 8.13 | 5.50 | 5.25 | 12.36 | 137.3 | 118.0 | 104.3 |
| Metals and products | 25.80 | 30.14 | 30.77 | 29.25 | 34.20 | 215.9 | 157.1 | 124.9 |
| Wood, lumber & related products | 21.55 | 17.21 | 16.41 | 18.72 | 22.66 | 132.2 | 112.8 | 111.3 |
| Petroleum, coal and natural gas | 10.16 | 3.55 | -3.77 | -6.44 | 9.36 | 216.1 | 172.0 | 124.0 |

Robert Brusca
AuthorMore in Author Profile »Robert A. Brusca is Chief Economist of Fact and Opinion Economics, a consulting firm he founded in Manhattan. He has been an economist on Wall Street for over 25 years. He has visited central banking and large institutional clients in over 30 countries in his career as an economist. Mr. Brusca was a Divisional Research Chief at the Federal Reserve Bank of NY (Chief of the International Financial markets Division), a Fed Watcher at Irving Trust and Chief Economist at Nikko Securities International. He is widely quoted and appears in various media. Mr. Brusca holds an MA and Ph.D. in economics from Michigan State University and a BA in Economics from the University of Michigan. His research pursues his strong interests in non aligned policy economics as well as international economics. FAO Economics’ research targets investors to assist them in making better investment decisions in stocks, bonds and in a variety of international assets. The company does not manage money and has no conflicts in giving economic advice.
More Economy in Brief