 Global| Jan 26 2007
New Home Sales Up Much More Than Expected
by:Tom Moeller
|in:Economy in Brief
Summary
Mild weather likely was behind a 4.8% gain in new home sales to 1.120M last month after an upwardly revised 7.4% jump during November. The latest gain by far outpaced Consensus estimates for 1.05M sales (see Haver's AS1REPNA [...]

Mild weather likely was behind a 4.8% gain in new home sales to 1.120M last month after an upwardly revised 7.4% jump during November. The latest gain by far outpaced Consensus estimates for 1.05M sales (see Haver's AS1REPNA database).
Despite the recent gains, new home sales last year fell 16.4%, the steepest decline since 1990, but for the whole year were at the fourth highest level on record.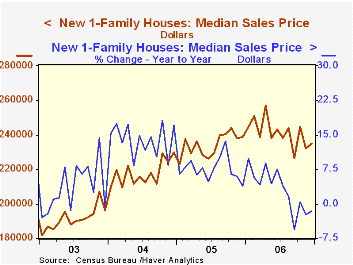
In the Northeast sales rose 27.3% (18.3% y/y) after the 65.0% November surge but for the year were down 21.0%. In the Midwest sales rose 26.6% (-2.4% y/y) but for the whole year fell 19.1% and out West sales slipped 4.4% (-27.1% y/y) and fell 25.3% for the year. Sales in the South ticked up 0.3% (-8.9% y/y) during December and for the year were off 10.0%.
The median new home price rose 1.2% (-1.5%) to $235,000. The 3.0% gain for the full year was the weakest since 1995. Downward revisions were sharp to recent price figures
The inventory of unsold home fell for the fifth straight month.
| US New Homes | December | November | Y/Y | 2006 | 2005 | 2004 |
|---|---|---|---|---|---|---|
| Total Sales (SAAR, 000s) | 1,120 | 1,069 | -11.0% | 1,070 | 1,280 | 1,201 |
| Median Price (NSA, $) | 235,000 | 232,200 | -1.5% | 241,125 | 234,208 | 217,817 |
by Tom Moeller January 26, 2007
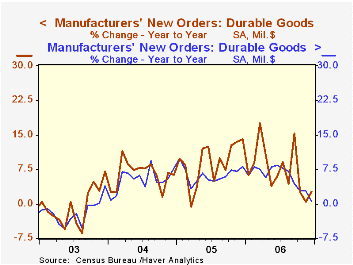
The 3.1% surge in new orders for durable goods about matched Consensus expectations and followed an upwardly revised 2.2% increase in November. For the year durable goods orders rose 7.1%, down just moderately from the 9.0% gain during 2005 but much of the strength reflected gains at the end of 2005 and early 2006.
During the last ten years there has been a 69% correlation between the y/y change in durable goods orders and the change in output of durable goods..
Another strong 24.8% (-8.6% y/y) gain in total aircraft & parts orders boosted durable goods bookings last month after a 13.2% rise during November. Orders for motor vehicles & parts even turned in a sharp 6.8% (0.0% y/y) gain. Yet less transportation altogether, orders still rose 2.3% and made up for most of the declines during the prior two months.
Orders for nondefense capital goods less aircraft rose 2.4% reflecting a 5.0% (6.1% y/y) surge in machinery orders. During the last ten years there has been an 86% correlation between the y/y change in capital goods orders less aircraft and the y/y change in business fixed investment in equipment & software from the GDP accounts.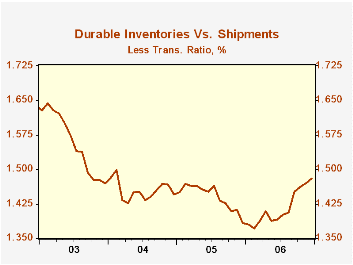
Orders for computers & electronic products rose 1.0% (11.4% y/y) after an 8.0% November spike. Primary metals orders also jumped 4.5% (9.1% y/y) making up nearly all of the declines during the prior tree months.
Shipments of durable goods gained 0.8% (0.5% y/y) after flat-to-down movement over the prior several months. Less the transportation sector, however, shipments fell 0.1% (+2.1% y/y) for the fourth consecutive monthly decline. During the last ten years there has been an 82% correlation between the y/y change in durable goods shipments and the change in industrial production of durable goods.
Durable inventories again rose moderately, by 0.4% (8.4% y/y) after a 0.3% November rise. Less the transportation sector, however, inventories doubled the modest 0.3% November gain with a 0.6% (9.3% y/y) increase. The inventory to shipments ratio outside of transportation, as a result, rose further to the highest level since early 2004.
| NAICS Classification | December | November | Y/Y | 2006 | 2005 | 2004 |
|---|---|---|---|---|---|---|
| Durable Goods Orders | 3.1% | 2.2% | 2.6% | 7.1% | 9.0% | 6.4% |
| Excluding Transportation | 2.3% | -1.0% | 5.1% | 8.1% | 9.4% | 7.6% |
| Nondefense Capital Goods | 9.0% | -0.3% | 0.9% | 9.7% | 21.4% | 5.6% |
| Excluding Aircraft | 2.4% | -1.0% | 6.7% | 9.2% | 12.3% | 2.8% |
by Carol Stone January 26, 2007
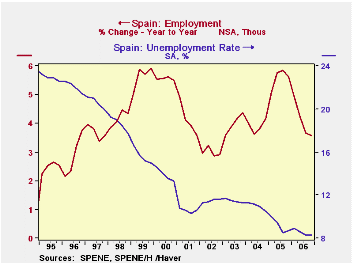
The number of employed workers in Spain passed 20 million in Q4, a record and a new milestone. The Spanish labor market continues to impress with its vigor. Growth rates are moderating a bit, but conditions remain strong overall. The unemployment rate was 8.3%, seasonally adjusted, the same as in Q3 and the lowest since Q2 1979, more than 27 years ago. Labor force participation increased to 58.6%, also a record for this data, which began just over 30 years ago; this rate has gone up about a percentage point a year for the last five years.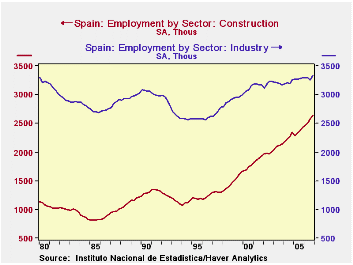
We wrote about Spain's unique labor market last October, on the release of Q3 data. We noted then that the "industry" sector was holding up in Spain, even as it was declining elsewhere in Europe. In Q4, Spanish industry employment firmed, so it now has 31,000 more jobs, 0.9%, than in Q4 2005. European-wide data are not yet available for Q4, but through Q3, they were running 1.0% below a year ago. In other Spanish activity, the service sector had slower growth in Q4, "just" 4.3% year-on-year; the year as a whole was up 5.1%, the third year in the last four with more than 5% growth in service sector jobs. The real star is construction, as is easily evident in the second graph. Job growth there has picked up this year, with 8.3% in Q4 over the year earlier. For all of 2006, construction jobs increased 7.9%, the fastest in five years.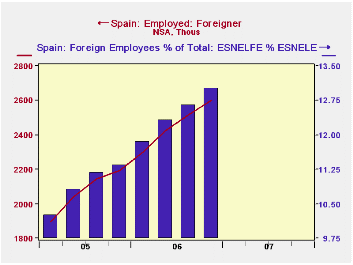
Another striking feature of the Spanish labor market is the participation of foreign workers. It may be that other countries are experiencing this phenomenon, but we have not been aware of it. Foreigners in Spain who are of working age (over 16) constitute 10.2% of that age segment of the total population, but they are 13% of the employees. While they have a higher unemployment rate than the population as a whole, 12.0% versus the total 8.3%, they are far more active in the labor market, with a participation rate of 77.6% compared to the overall 58.3%. Clearly immigrants come to Spain to look for work and persist in trying to get it.
Seasonal adjustment of Spain's employment and unemployment series is done by Haver Analytics. These series are in Haver's "G10" database. Other data, especially that on foreign workers, is carried in the SPAIN database, the "country-sourced" database in which data are presented in the style in which they are published by the national statistical sources.
| SPAIN | Q4 2006 | Q3 2006 | Q4 2005 | 2006 | 2005 | 2004 |
|---|---|---|---|---|---|---|
| Employment (Millions, SA) | 20.01 | 19.81 | 19.32 | 19.75 | 18.97 | 17.97 |
| Industry | 3.33 | 3.26 | 3.30 | 3.29 | 3.28 | 3.21 |
| Construction | 2.64 | 2.58 | 2.44 | 2.54 | 2.36 | 2.25 |
| Services | 13.13 | 13.02 | 12.59 | 12.97 | 12.34 | 11.52 |
| Unemployment Rate (%, SA) | 8.3 | 8.3 | 8.7 | 8.5 | 9.1 | 11.0 |
| Participation Rate (%, SA) | 58.6 | 58.4 | 57.7 | 58.3 | 57.3 | 56.3 |
| Foreign % of Working Age Population (NSA) | 10.2 | 9.9 | 9.0 | 9.8 | 8.5 | -- |
| Foreign % of Employment (NSA) | 13.0 | 12.7 | 11.3 | 12.5 | 10.9 | -- |

Tom Moeller
AuthorMore in Author Profile »Prior to joining Haver Analytics in 2000, Mr. Moeller worked as the Economist at Chancellor Capital Management from 1985 to 1999. There, he developed comprehensive economic forecasts and interpreted economic data for equity and fixed income portfolio managers. Also at Chancellor, Mr. Moeller worked as an equity analyst and was responsible for researching and rating companies in the economically sensitive automobile and housing industries for investment in Chancellor’s equity portfolio. Prior to joining Chancellor, Mr. Moeller was an Economist at Citibank from 1979 to 1984. He also analyzed pricing behavior in the metals industry for the Council on Wage and Price Stability in Washington, D.C. In 1999, Mr. Moeller received the award for most accurate forecast from the Forecasters' Club of New York. From 1990 to 1992 he was President of the New York Association for Business Economists. Mr. Moeller earned an M.B.A. in Finance from Fordham University, where he graduated in 1987. He holds a Bachelor of Arts in Economics from George Washington University.
More Economy in Brief


