 Global| May 24 2010
National Association For BusinessEconomics Expects Positive Growth, Low Inflation & Higher Interest Rates
by:Tom Moeller
|in:Economy in Brief
Summary
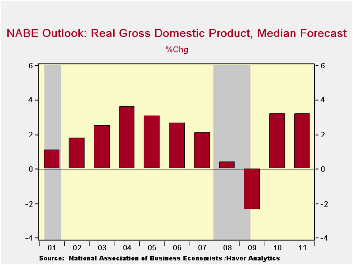
The National Association For Business Economics (NABE) indicated in its latest survey of 46 economists that economic growth would continue this year and next at a 3.2% rate. Though that expectation is slightly higher than the 3.1% [...]
 >
>
The National Association For Business Economics (NABE) indicated in its latest survey of 46 economists that economic growth would continue this year and next at a 3.2% rate. Though that expectation is slightly higher than the 3.1% growth forecasted in the February survey, it remains well short of the four-to-seven percent growth following past severe recessions.
Improved, but still subpar, growth in consumer spending is expected to bolster the economic recovery. Growth of 2.6% and 2.8% compares to the five percent growth after prior recessions.
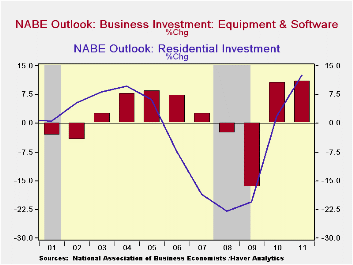
Capital spending also is expected to improve -- and with more momentum -- than the consumer's rebound. The 11% gains in equipment spending this year and next are just shy of the higher double-digit gains following earlier recessions. The recovery in residential investment, while respectable at 12.6% in 2011, follows subpar growth this year and compares to the up to 41% gains after earlier, severe downturns.
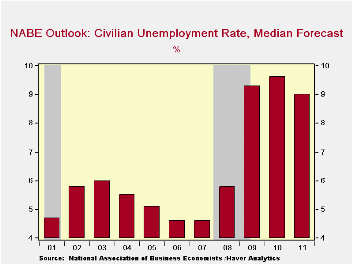
As a result of the economic rebound, the unemployment rate is
expected to fall. Here again, however, the half a percentage point
decline is much smaller than the one-to-three point drops after earlier
recessions. That implied level of continued economic slack is expected
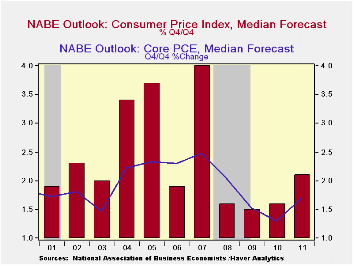
to leave core consumer price inflation roughly stable near 1.5%.
Overall inflation remains relatively higher at 2.0% due to higher oil
prices which is expected to average $88.80 per barrel of crude next
year while interest rates rise modestly with the economic recovery.
| Nat'l Assn. For Business Economics Outlook | 2011 | 2010 | 2009 |
|---|---|---|---|
| Real GDP (%) | 3.2 | 3.2 | -2.4 |
| Personal Consumption Expenditures | 2.8 | 2.6 | -0.6 |
| Capital Spending - Structures | -1.1 | -12.6 | -19.7 |
| Capital Spending - Equipment & Software | 11.0 | 10.7 | -16.9 |
| Residential Investment | 12.6 | 1.9 | -20.4 |
| Unemployment Rate | 9.0 | 9.6 | 9.3 |
| CPI | 2.0 | 2.0 | -0.3 |
| Price Index - PCE Less Food & Energy | 1.7 | 1.3 | 1.4 |
| 10-Year Treasury Note | 4.70 | 4.20 | 3.85 |
by Tom Moeller May 24, 2010
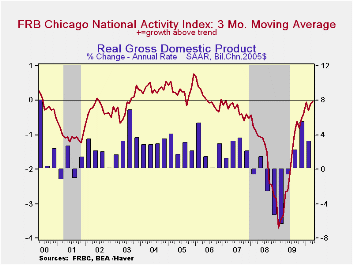
Economic growth continued to improve last month. The Chicago Fed indicated that its National Activity Index (CFNAI) rose to 0.29 from an upwardly revised March level. The increase was to the highest level since 2006 and added to earlier gains from the series' low of -4.14 reached in January '09. During the last ten years the has been a 76% correlation between the index level and the q/q change in real GDP.
The three-month moving average of the index, which smoothes out some of the series' volatility, also rose to its highest level since early-2007.
An index level at or below -0.70 typically has indicated negative U.S. economic growth. A zero value of the CFNAI indicates that the economy is expanding at its historical trend rate of growth of roughly 3.0%. The complete CFNAI report is available here.
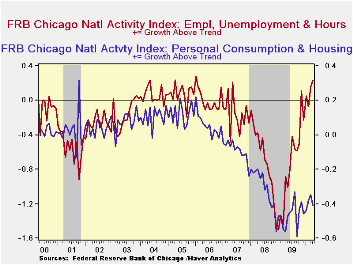
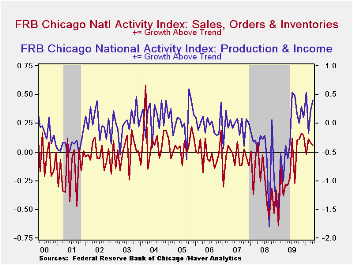
The Chicago Fed indicated that rebounds in the employment and in the production components contributed to the total index improvement. Overall, 51 of the 85 individual indicators made positive contributions to the index while 34 made negative contributions. The CFNAI is a weighted average of 85 indicators of economic activity. The indicators reflect activity in the following categories: production & income, the labor market, personal consumption & housing, manufacturing & trade sales, and inventories & orders.
In a separate survey, the Chicago Fed indicated that its Midwest manufacturing index improved during March to its highest level since December 2008. Indicators for the auto, steel, machinery and resource sectors each rose. The Chicago Federal Reserve figures are available in Haver's SURVEYS database.
| Chicago Fed | April | March | February | April '09 | 2009 | 2008 | 2007 |
|---|---|---|---|---|---|---|---|
| CFNAI | 0.29 | 0.13 | -0.52 | -2.12 | -1.61 | -1.80 | -0.3 |
| 3-Month Moving Average | -0.03 | -0.09 | -0.29 | -2.65 | -- | -- | -- |
| Personal Consumption & Housing | -0.41 | -0.35 | -0.38 | -0.56 | -0.49 | -0.32 | -0.09 |
| Employment, Unemployment & Hours | 0.23 | 0.16 | -0.07 | -0.89 | -0.76 | -0.67 | -0.15 |
| Production & Income | 0.41 | 0.23 | -0.16 | -0.39 | -0.23 | -0.56 | -0.05 |
| Sales, Inventories & Orders | 0.06 | 0.08 | 0.11 | -0.28 | -0.13 | -0.25 | -0.06 |
by Tom MoellerMay 24, 2010
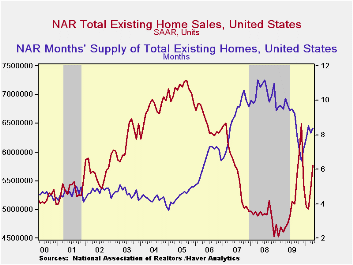
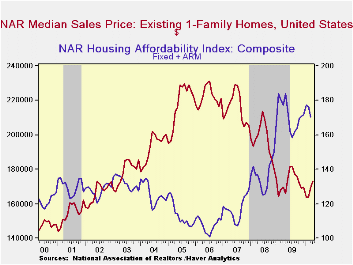
Hopefully, recent improvement in existing single-family home sales wasn't all due to buying ahead of the April 30th expiration of a Federal home-buyer tax credit. Existing home sales rose 7.6% last month to 5.770M (AR) according to the National Association of Realtors. The gain followed a similar rise in March which followed declines during the prior thee months. Sales in April exceeded Consensus expectations for 5.65M. Total sales include sales of condos and co-ops. Sales of existing single-family homes alone rose 7.4% from March to 5.050M. (These data have a longer history than the total sales series). Sales of condos and co-ops rose 42.3% from last year.
Sales have been helped by a tax credit for first-time home buyers. Additionally, a credit of up to $6,500 was available to some existing home owners who move. The full details of the home-buyer tax credit can be found here.
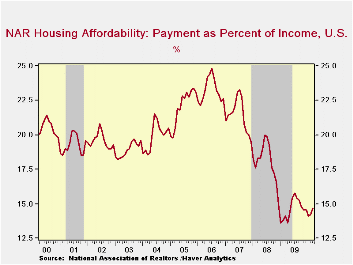
The median price of all existing homes also rose in April to $173,100 but remained off roughly 25% from the 2007 peak. The price of a single-family home rose 2.3% to $173,400 (4.5% y/y). Earlier price weakness sharply raised home affordability -- by three-quarters from the 2006 low. The median family income for existing home buyers was $60,498 and mortgage payments amounted to 14.7% of that total.
The number of unsold homes (single-family & co-ops) for sale rose sharply m/m, up 2.7% y/y. At the current sales rate there was an 8.4 months' supply of homes on the market. That was down from a high of 10.1 months during April of 2008. For single-family homes, the inventory rose m/m to an 8.2 months' supply.
The data on existing home sales, prices and affordability can be found in Haver's USECON database. The regional price, affordability and inventory data is available in the REALTOR database.
| Existing Home Sales (Thous, SAAR) | April | March | February | April y/y | 2009 | 2008 | 2007 |
|---|---|---|---|---|---|---|---|
| Total | 5,770 | 5,360 | 5,010 | 22.8% | 5,160 | 4,893 | 5,674 |
| Northeast | 1,090 | 900 | 840 | 41.6 | 863 | 845 | 1,010 |
| Midwest | 1,330 | 1.210 | 1,110 | 29.1 | 1,166 | 1,130 | 1,331 |
| South | 2,140 | 1,970 | 1,840 | 23.0 | 1,913 | 1,860 | 2,243 |
| West | 1,210 | 1,290 | 1,220 | 5.2 | 1,216 | 1,064 | 1,095 |
| Single-Family Sales | 5,050 | 4,700 | 4,360 | 20.5 | 4,573 | 4,341 | 4,960 |
| Median Price, Total, $ (NSA) | 173,100 | 169,600 | 164,600 | 4.0 | 172,742 | 197,233 | 216,633 |
by Robert Brusca May 24, 2010
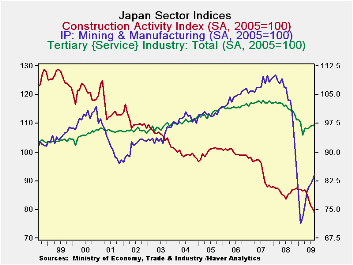
After an encouraging spurt in January Japan’s overall sector index has fallen back for two straight months and is back barely above its level of December 2009. Only the industry index is up this month. The industrial index is up in 12 of the last 13-months but the even the pace of its increase is tailing off. The construction index is still eroding. The tertiary index which is a measure of the performance of the services sector is on a steady slow path of recovery but it fell sharply in March and in February. The tertiary index is below its December 2009 level.
The construction index is near the bottom of its five year range of values. The services sector is in the bottom 12% of its five year range. The industrial sector is the best performing sector but stands only in the 60th percentile of its range. As a result of these standings the overall business index resides in the 28th percentile of its range.
The sector indices paint an unclear picture of the Japanese economy. While the trends for the indices are still rising, except for construction, the recent weakness for industry and services is disturbing.
| Key Japanese Sector Surveys | |||||||
|---|---|---|---|---|---|---|---|
| Raw readings of each survey | Percent of 5Yr range* | ||||||
| Indices | Mar-10 | Feb-10 | Jan-10 | Dec-09 | Mar-10 | Feb-10 | Jan-10 |
| Biz Activity(METI:Indices) | 93.8 | 94.6 | 96.8 | 93.6 | 28.4% | 34.3% | 50.7% |
| Construction | 75.2 | 78.2 | 75.0 | 74.5 | 2.6% | 13.9% | 1.9% |
| Industry | 94.8 | 93.7 | 94.3 | 90.4 | 60.5% | 57.6% | 59.2% |
| Tertiary(serv) | 95.5 | 98.5 | 98.8 | 96.0 | 12.1% | 45.1% | 48.4% |
by Louise Curley May 24, 2010
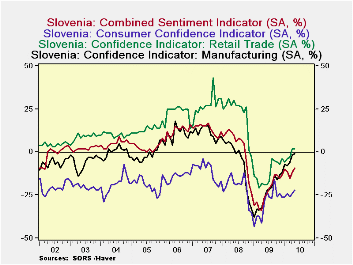
The financial turmoil in the Euro Area has resulted in a sharp drop in confidence in the Euro Area, as a whole. The ZEW Indicator of Expectations for the entire Euro Area, released last week, fell from a balance of optimists of 46.0% in April to 37.6% in May. Today, however, Slovenia, one of the smaller nations and one of the more recent members of the euro area. reported today an increase in confidence. (Slovenia has a population of about 2 million and entered the Euro Area on January 1, 2007) The Statistical Office of Slovenia publishes an overall sentiment indicator, which is based on three separate indicators: consumer confidence, confidence in retail trade and in manufacturing. The indicators are in the form of percent balances.
Although the overall indicator still shows an excess of pessimists, the excess of pessimists declined in May to 9 from 12. This is the best balance since October of 2008. Business personnel in Slovenia appear to be more positive than the consumer. In Retail trade, there is actually a small excess-2%-of optimists over pessimists and in Manufacturing, the pessimists outweigh the optimists by only 1%. There are, however, many more pessimists among the consumers. They exceeded the optimists by 22% in May, but this was an improvement over April's excess of pessimist of 24%. The percent balance of the four indicators are shown in the first chart.
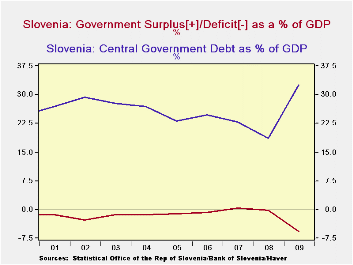
The improvement in confidence in May in Slovenia, in contrast to a decline for the Euro Area as a whole, may be due in part to Slovenia's relatively favorable financial situation. Although its government deficit as a percentage of GDP increased in 2009, part of the increase reflects the decline in GDP and may improve as the economy recovers. The level of debt to GDP is well below any danger point These ratios are shown in the second chart.
| SLOVENIA | May 10 | Apr 10 | Mar 10 | Feb 10 | Jan 10 | Dec 09 | Nov 09 | Oct 09 |
|---|---|---|---|---|---|---|---|---|
| Combined Sentiment Indicator (% Bal) | -9 | -12 | -15 | -11 | -10 | -13 | -15 | -13 |
| Consumer Confidence Indicator (% Bal) | -22 | -24 | -26 | -24 | -26 | -26 | -24 | -21 |
| Retail Confidence Indicator (% Bal) | 2 | 2 | -3 | -4 | -6 | -4 | -7 | -6 |
| Manufacturing Confidence Indicator (%Bal) | -1 | -2 | -6 | -8 | -7 | -12 | -13 | -16 |

Tom Moeller
AuthorMore in Author Profile »Prior to joining Haver Analytics in 2000, Mr. Moeller worked as the Economist at Chancellor Capital Management from 1985 to 1999. There, he developed comprehensive economic forecasts and interpreted economic data for equity and fixed income portfolio managers. Also at Chancellor, Mr. Moeller worked as an equity analyst and was responsible for researching and rating companies in the economically sensitive automobile and housing industries for investment in Chancellor’s equity portfolio. Prior to joining Chancellor, Mr. Moeller was an Economist at Citibank from 1979 to 1984. He also analyzed pricing behavior in the metals industry for the Council on Wage and Price Stability in Washington, D.C. In 1999, Mr. Moeller received the award for most accurate forecast from the Forecasters' Club of New York. From 1990 to 1992 he was President of the New York Association for Business Economists. Mr. Moeller earned an M.B.A. in Finance from Fordham University, where he graduated in 1987. He holds a Bachelor of Arts in Economics from George Washington University.
More Economy in Brief


