 Global| Jan 24 2010
National Association For Business Economics (NABE) Survey Shows Improvement
by:Tom Moeller
|in:Economy in Brief
Summary
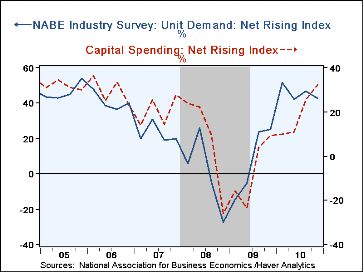
NABE indicated in its latest Industry Survey that despite level demand throughout last year, most other economic conditions firmed. The index of unit demand improved sharply as 2010 began, but momentum waned as the year progressed. [...]
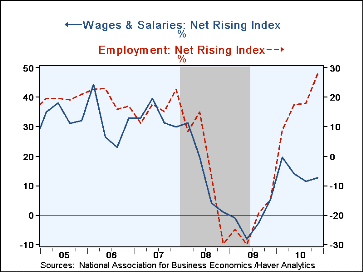
NABE indicated in its latest Industry Survey that despite level demand throughout last year, most other economic conditions firmed. The index of unit demand improved sharply as 2010 began, but momentum waned as the year progressed. Nevertheless, as the percent of firms reporting higher demand rose moderately, the percent reporting lower demand fell sharply. The recovery in demand from the recession low necessitated more employment. The hiring index rose to its highest since 2006 as the percent of firms adding to payrolls surged. Capital spending plans improved in lockstep.
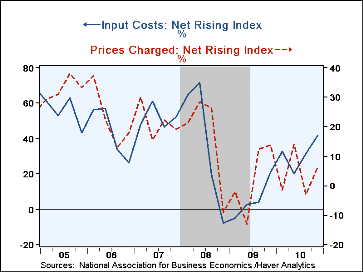
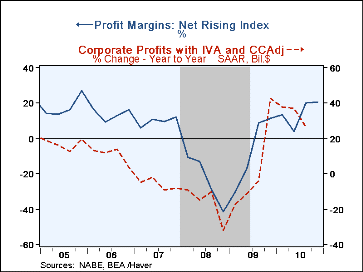
Gains on the product & employment side of firms' ledgers induced higher costs. By the end of the year, input costs had surged. Nearly half of firms faced higher and just a few reported falling costs. Despite higher costs, heightened competitive forces left firms with little ability to pass them along in the form of higher prices. The prices charged index was roughly stable, at a low level, with 2009. Encouraging, however, was that despite weak pricing power, firms' profit margins jumped to nearly the series' high. Government numbers showing improved worker productivity had a real effect on firms' bottom lines. Part of the reason costs remained under control was the modest recovery in wages & salaries.
In just the goods producing sector alone, unit demand weakened more than the overall figures indicated and profit margins plummeted into negative territory.
| National Association For Business Economics Industry Survey | Q4'10 | Q3'10 | Q2'10 | Q1'10 | 2010 | 2009 | 2008 |
|---|---|---|---|---|---|---|---|
| Conditions Over Last Three Months: Net Rising Index | |||||||
| Unit Demand | 42.7 | 46.5 | 42.0 | 51.5 | 45.7 | 7.3 | -0.2 |
| Employment | 27.7 | 17.8 | 17.3 | 8.8 | 17.9 | -22.2 | -3.4 |
| Capital Spending | 32.1 | 25.4 | 10.8 | 9.8 | 19.5 | -6.5 | 7.3 |
| Input Costs | 41.4 | 31.3 | 20.0 | 32.6 | 31.3 | 5.5 | 37.0 |
| Prices Charged | 6.3 | -2.9 | 13.9 | -1.5 | 4.0 | 2.8 | 16.8 |
| Profit Margins | 20.5 | 20.3 | 3.9 | 13.1 | 14.4 | -6.8 | -23.5 |
| Wages & Salaries | 12.5 | 11.4 | 14.1 | 19.7 | 14.4 | -1.5 | 14.0 |
| Goods Producing Industries | |||||||
| Unit Demand | 40.9 | 27.8 | 69.2 | 60.0 | 49.5 | -15.0 | -33.0 |
| Profit Margins | -4.8 | 23.5 | 25.0 | 30.8 | 18.6 | -18.9 | -31.1 |
Tom Moeller
AuthorMore in Author Profile »Prior to joining Haver Analytics in 2000, Mr. Moeller worked as the Economist at Chancellor Capital Management from 1985 to 1999. There, he developed comprehensive economic forecasts and interpreted economic data for equity and fixed income portfolio managers. Also at Chancellor, Mr. Moeller worked as an equity analyst and was responsible for researching and rating companies in the economically sensitive automobile and housing industries for investment in Chancellor’s equity portfolio. Prior to joining Chancellor, Mr. Moeller was an Economist at Citibank from 1979 to 1984. He also analyzed pricing behavior in the metals industry for the Council on Wage and Price Stability in Washington, D.C. In 1999, Mr. Moeller received the award for most accurate forecast from the Forecasters' Club of New York. From 1990 to 1992 he was President of the New York Association for Business Economists. Mr. Moeller earned an M.B.A. in Finance from Fordham University, where he graduated in 1987. He holds a Bachelor of Arts in Economics from George Washington University.
More Economy in Brief
 Global| Feb 05 2026
Charts of the Week: Balanced Policy, Resilient Data and AI Narratives
by:Andrew Cates


