 Global| Jul 26 2006
Mortgage Applications Wilt Under Summer Heat
by:Tom Moeller
|in:Economy in Brief
Summary
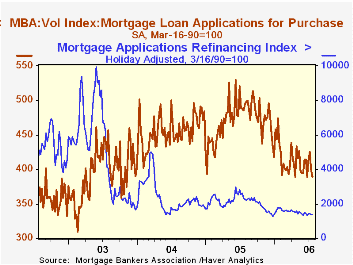
The total number of mortgage applications fell another 1.3% last week and pulled applications so far in July down 1.0% from the prior month's average. Applications in June fell 1.5% from May. Purchase applications added 2.4% to the [...]
The total number of mortgage applications fell another 1.3% last week and pulled applications so far in July down 1.0% from the prior month's average. Applications in June fell 1.5% from May.
Purchase applications added 2.4% to the prior week's 6.2% steep decline. Therefore, in July the average number of applications are 0.3% below June which fell 0.8% from May.
During the last ten years there has been a 58% correlation between the y/y change in purchase applications and the change in new plus existing single family home sales.
Applications to refinance recovered 0.6% of the 1.6% declines during the prior two weeks. The small increase left the July average 2.3% below the prior month and refis during all of June fell 3.1% from the May average.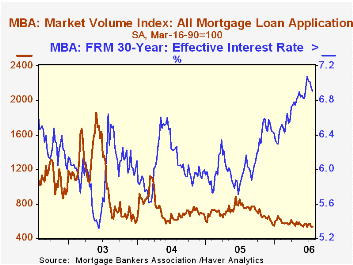
The effective interest rate on a conventional 30-year mortgage fell five basis points w/w to 6.91%. The peak for 30 year financing was 7.08% late in June. The rate on 15-year financing also fell six basis points to 6.57% and the peak rate was 6.75%. Interest rates on 15 and 30 year mortgages are closely correlated (>90%) with the rate on 10 year Treasury securities.
During the last ten years there has been a (negative) 79% correlation between the level of applications for purchase and the effective interest rate on a 30-year mortgage.
The Mortgage Bankers Association surveys between 20 to 35 of the top lenders in the U.S. housing industry to derive its refinance, purchase and market indexes. The weekly survey accounts for more than 40% of all applications processed each week by mortgage lenders. Visit the Mortgage Bankers Association site here.
| MBA Mortgage Applications (3/16/90=100) | 07/21/06 | 07/14/06 | Y/Y | 2005 | 2004 | 2003 |
|---|---|---|---|---|---|---|
| Total Market Index | 533.8 | 540.8 | -29.2% | 708.6 | 735.1 | 1,067.9 |
| Purchase | 389.0 | 398.5 | -19.8% | 470.9 | 454.5 | 395.1 |
| Refinancing | 1,385.2 | 1,377.6 | -40.3% | 2,092.3 | 2,366.8 | 4,981.8 |
by Tom Moeller July 26, 2006
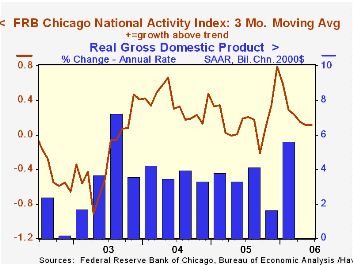
The National Activity Index (CFNAI) from the Federal Reserve Bank of Chicago rose to the highest level (0.34) since March. The gain, nevertheless, failed to prevent the 2Q average from falling to 0.11 from 0.24 in 1Q.
The three-month moving average of the CFNAI remained stable with May at that 0.11 level which is the lowest since October.
A zero value of the CFNAI indicates that the economy is expanding at its historical trend rate of growth and during the last twenty years there has been a 68% correlation between the level of the CFNAI and q/q growth in real GDP.
The CFNAI is a weighted average of 85 indicators of economic activity. The indicators reflect activity in the following categories: production and income, the labor market, personal consumption and housing, manufacturing and trade sales, and inventories & orders.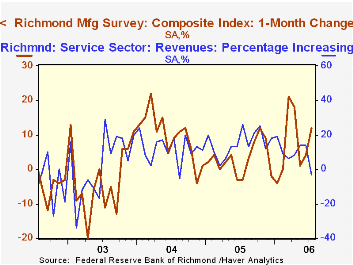
The latest CFNAI report is available here.
The Federal Reserve Bank of Richmond reported that its July Composite Index from the manufacturing survey rose to the highest level (12) since April. During the last ten years there has been a 38% correlation between the diffusion index level and the one month change in U.S. manufacturing industrial production. The July report can be found here.
The Richmond Fed's survey of the service sector, conversely, deteriorated in July. The percentage of firms reporting increasing revenues was negative (-3) for the first month in nearly two years. The latest report is available here.
Economy on cruise control through 2007 from the Federal Reserve Bank of Chicago can be found here.
| Chicago Fed | June | May | June '05 | 2005 | 2004 | 2003 |
|---|---|---|---|---|---|---|
| CFNAI | 0.34 | -0.14 | 0.36 | 0.20 | 0.37 | -0.11 |
by Carol Stone July 26, 2006
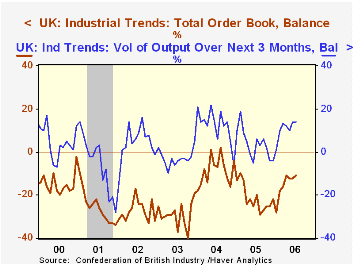
Yesterday, Louise Curley wrote about improving business confidence in three European nations, France, Italy and the Netherlands. In the UK the situation is somewhat ambiguous, according to the July survey of the Confederation of British Industries (CBI). The key monthly series, the total order book in volume terms, improved modestly, as it moved to -11 for July from -12 in June and May. At the same time these are obviously still negative, but they are all better readings than prevailed during much of 2005, which averaged -20. Export orders faltered this month. They reached 0 in May, the first non-negative reading since February 1996, but have drifted off in the two succeeding months to -6 for July. This appears to reverse the situation that had seemed to be in place in which domestic demand was fading while the export sector improved.
The CBI also published their quarterly data, which query companies' general sentiment and strategic plans. The measure on overall business sentiment deteriorated to -6 for Q3 from -2 in Q2. Even so, conditions are viewed less negatively than most of the time over the last five years. Sentiment about exports actually turned positive during last quarter and this, suggesting the downturn in orders reported above may be temporary.
Another favorable turn comes in the area of plant capacity. The proportion of companies that believe their capacity is adequate for their production plans in the coming year fell to 83%, the lowest reading since Q4 1997. In the interim, this share has run as high as 94% and that as recently as Q3 2003. When that many companies believe they have enough capacity, it's hard to anticipate there would be much capital expenditure. Now, as the adequacy ratio has fallen, the outlook for plant and equipment outlays has improved to a -9% balance in Q2 and -10% in Q3 from -23% back in 2003 when the adequacy ratio was near its recent peak. (The all-time high adequacy ratio was 99% during the 1980 recession.)
Thus, British industry managers see their outlook in fairly murky terms. Orders are improved but still falling. Export markets look stronger, but then they fade. Capital spending plans look better, but they are still declining at more companies than rising. In the Q2 GDP report last week, we saw the manufacturing sector with its first year-on-year increase since late 2004. But there are still numerous questions about demand prospects, energy prices and other uncertainties to presume this outcome will improve further or even be sustained.
| UK: % Balance | July 2006 | June 2006 | May 2006 | Year Ago | 2005 | 2004 | 2003 |
|---|---|---|---|---|---|---|---|
| CBI Total Orders | -11 | -12 | -12 | -20 | -21 | -9 | -29 |
| Export Orders | -6 | -3 | 0 | -17 | -20 | -13 | -33 |
| Q3 2006 | Q2 2006 | Q1 2006 | -- | -- | -- | -- | |
| Overall Business Optimism | -6 | -2 | -14 | -16 | -19 | 7 | -17 |
| Optimism re Exports | 5 | 3 | -5 | -8 | -6 | 7 | -15 |
| Adequate Capacity | 83 | 86 | 90 | 88 | 90 | 89 | 93 |
| Plant & Machinery Expenditures next 12 months | -10 | -9 | -14 | -15 | -17 | -3 | -21 |

Tom Moeller
AuthorMore in Author Profile »Prior to joining Haver Analytics in 2000, Mr. Moeller worked as the Economist at Chancellor Capital Management from 1985 to 1999. There, he developed comprehensive economic forecasts and interpreted economic data for equity and fixed income portfolio managers. Also at Chancellor, Mr. Moeller worked as an equity analyst and was responsible for researching and rating companies in the economically sensitive automobile and housing industries for investment in Chancellor’s equity portfolio. Prior to joining Chancellor, Mr. Moeller was an Economist at Citibank from 1979 to 1984. He also analyzed pricing behavior in the metals industry for the Council on Wage and Price Stability in Washington, D.C. In 1999, Mr. Moeller received the award for most accurate forecast from the Forecasters' Club of New York. From 1990 to 1992 he was President of the New York Association for Business Economists. Mr. Moeller earned an M.B.A. in Finance from Fordham University, where he graduated in 1987. He holds a Bachelor of Arts in Economics from George Washington University.
More Economy in Brief
 Global| Mar 26 2026
Charts of the Week: A Supply-Constrained World Comes into Sharper Focus
by:Andrew Cates
