 Global| Sep 21 2005
Mortgage Applications Up
by:Tom Moeller
|in:Economy in Brief
Summary
The total number of mortgage applications last week recouped all of the prior period's decline with a 1.5% increase, according to the Mortgage Bankers Association. Combined with a sharp gain earlier in the month, the rise lifted [...]
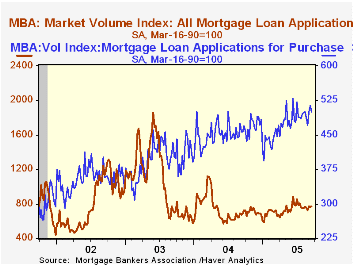
The total number of mortgage applications last week recouped all of the prior period's decline with a 1.5% increase, according to the Mortgage Bankers Association. Combined with a sharp gain earlier in the month, the rise lifted applications so far in September 2.9% above August.
Mortgage applications to refinance surged 7.0% w/w. The gain raised the September average 2.8% above August which fell 10.6% from July.
Purchase applications fell 2.6%, the first decline in three weeks. The average level in September so far is 3.1% above August. During the last ten years there has been a 49% correlation between the y/y change in purchase applications and the change in new plus existing single family home sales.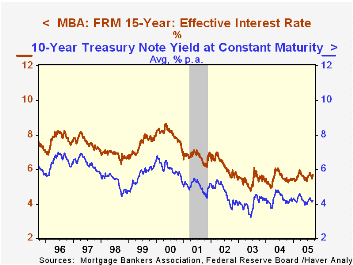
The effective interest rate on a conventional 30-year mortgage rose to 6.05% after three weeks slightly below 6.0%. The effective rate on a 15-year mortgage also fell to 5.69%, the highest level in a month. The interest rate on 15 and 30 year mortgages are closely correlated (>90%) with the rate on 10 year Treasury securities.
The Mortgage Bankers Association surveys between 20 to 35 of the top lenders in the U.S. housing industry to derive its refinance, purchase and market indexes. The weekly survey accounts for more than 40% of all applications processed each week by mortgage lenders. Visit the Mortgage Bankers Association site here.
Housing Markets and Demographics from the Federal Reserve Bank of San Francisco can be found here.
| MBA Mortgage Applications (3/16/90=100) | 09/16/05 | 09/09/05 | Y/Y | 2004 | 2003 | 2002 |
|---|---|---|---|---|---|---|
| Total Market Index | 772.2 | 760.6 | 11.8% | 735.1 | 1,067.9 | 799.7 |
| Purchase | 500.3 | 513.4 | 9.6% | 454.5 | 395.1 | 354.7 |
| Refinancing | 2,353.7 | 2,198.7 | 14.7% | 2,366.8 | 4,981.8 | 3,388.0 |
by Tom Moeller September 21, 2005
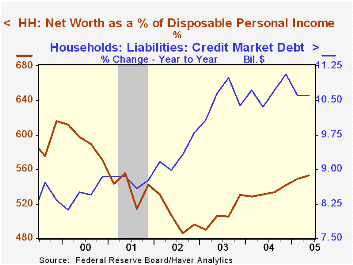
In 2Q, the net worth of the US household sector improved 1.9% (9.4% y/y) to a record $49.8 trillion. The gain lifted net worth not to a historical high versus income, but the highest in four years (5.5 times).
Household sector asset values rose 9.7% y/y due to a 13.8% rise in the value of real estate holdings. Financial asset values rose 7.1%, still half the gain in 2003 and held back by higher interest rates which reduced the growth in Treasury security holdings to a negative 2.2% y/y. Money market share values also fell by 4.8%. Higher prices in the stock market helped lift the value of mutual fund shares by 14.0% but the value of corporate equities held directly fell 1.9%.
Growth in total credit market debt outstanding moved slightly higher to 8.5% y/y. Growth in the federal government debt slowed a bit to 7.3% y/y but US household debt growth continued strong at 10.6% y/y while non-financial corporations debt grew a faster 6.9% y/y.
| Flow of Funds | % of Total | 2Q 05 (AR) |
1Q 05 (AR) |
2004 |
2003 |
2002 |
|---|---|---|---|---|---|---|
| Total Credit Market Debt Outstanding | 7.9% | 7.3% | 8.2% | 8.9% | 7.7% | |
| Federal Government | 12% | -3.7% | 15.9% | 9.0% | 10.9% | 7.6% |
| Households | 28% | 10.6% | 9.7% | 11.1% | 10.4% | 9.8% |
| Nonfinancial Corporate Business | 14% | 7.3% | 6.4% | 4.8% | 3.3% | 0.6% |
| Financial Sectors | 32% | 9.0% | 4.7% | 7.3% | 10.3% | 9.2% |
| Net Worth: Households & Nonprofit Organizations (Trillions) | $49.8 | $48.9 | $48.3 | $44.1 | $39.1 | |
| Tangible Assets | $23.9 | $23.2 | $22.5 | $20.0 | $18.4 |
by Carol Stone September 21, 2005
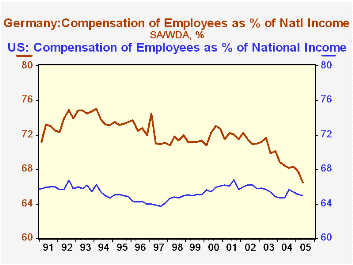
It is widely observed that there are major dislocations in European labor markets. Debate over reforms of present labor regulations in Germany, for instance, has basically paralyzed the government as last Sunday's elections gave no party or policy anything close to a majority vote.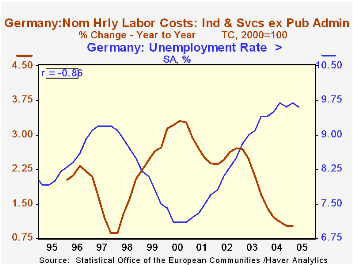
Thus, it is interesting that data reported today by Eurostat show that hourly labor costs in Europe have been rising rather modestly, and they compare favorably with similar information for the US. In the overall Euro-Zone, this gauge rose a mere 0.5% in Q2 (2.1% annualized) and was just 2.3% above a year ago. In Germany, where there is much distress in the labor market, the hourly labor cost index edged up just 0.1% in the quarter, and as seen in the table below, just 0.8% from a year ago. Somehow, public discussion of these labor developments gives the impression that the associated costs are quite high. But these costs increasing very slowly, and in the second graph, it is seen that they are retreating rapidly as a share of national income.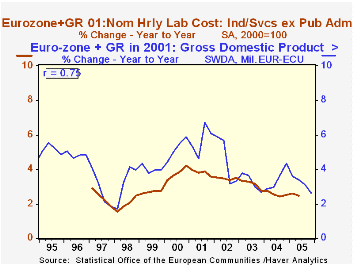
In the face of high unemployment in Germany, what we seem to have is an excellent example of a Phillips Curve phenomenon: high unemployment combined with low inflation of labor costs. Generally this is seen as a demand-driven condition, but here it is likely exacerbated by the rigidities in the applicable regulations.
In Europe as a whole, demand appears to be a leading force on labor costs. The correlation of GDP growth (in nominal terms) with labor cost increases is 48% in the same quarter, but with a two-quarter lead for GDP, the correlation jumps to 76%. In the last two quarters the pace of GDP has slowed further, suggesting that it is difficult to look for much improvement in labor compensation over the remainder of this year.
| Hourly Labor Cost Index | Q2 2005 | Q1 2005 | Q4 2004 | Q4/Q4|||
|---|---|---|---|---|---|---|
| 2003 | 2002 | 2001 | ||||
| Euro-Zone (SA, 2000=100) | 116.0 | 115.4 | 114.6 | 111.8 | 108.8 | 105.1 |
| Year/Year % Change* | 2.3 | 3.0 | 2.2 | 2.6 | 3.5 | 3.6 |
| Germany | 0.8 | 1.2 | 0.5 | 1.5 | 2.2 | 2.2 |
| France | 2.7 | 3.3 | 2.9 | 2.3 | 3.8 | 4.1 |
| Spain | 4.4 | 4.4 | 4.4 | 4.0 | 5.3 | 7.0 |
| US | -- | 3.4 | 3.8 | 4.0 | 3.2 | 4.2 |

Tom Moeller
AuthorMore in Author Profile »Prior to joining Haver Analytics in 2000, Mr. Moeller worked as the Economist at Chancellor Capital Management from 1985 to 1999. There, he developed comprehensive economic forecasts and interpreted economic data for equity and fixed income portfolio managers. Also at Chancellor, Mr. Moeller worked as an equity analyst and was responsible for researching and rating companies in the economically sensitive automobile and housing industries for investment in Chancellor’s equity portfolio. Prior to joining Chancellor, Mr. Moeller was an Economist at Citibank from 1979 to 1984. He also analyzed pricing behavior in the metals industry for the Council on Wage and Price Stability in Washington, D.C. In 1999, Mr. Moeller received the award for most accurate forecast from the Forecasters' Club of New York. From 1990 to 1992 he was President of the New York Association for Business Economists. Mr. Moeller earned an M.B.A. in Finance from Fordham University, where he graduated in 1987. He holds a Bachelor of Arts in Economics from George Washington University.
More Economy in Brief


